
|
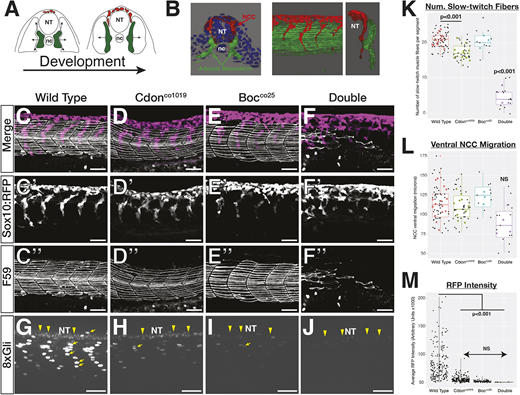
Fig. 3 cdon and boc affect NCC migration and slow-twitch muscle differentiation. (A) Schematic cross-sections of a 10-somite to 24 hpf embryo show NCC (red) and adaxial mesoderm (green) migration. Adaxial cells in green are specified adjacent to the notochord and migrate laterally to differentiate into slow-twitch muscle. NCCs (red) migrate ventrally from the dorsal neural tube. (B) 3D renderings of a 10 ?m cross-section from the trunk of a 15-somite (left) and a whole-mount 24 hpf embryo (right) showing association between migrating adaxial mesoderm (green) and NCCs (red). (C-F) Lateral views of maximum projection images show NCC streams, tg(sox10:mRFP) and immunostaining for slow-twitch muscle (F59; white) in 24 hpf wild-type embryos at the level of yolk extension. Single fluorescent images are shown in black and white below for tNCC (C?-F?) and adaxial cells (C?-F?). (G-J) Maximum projection images of tg(8�Gli:mCherry) transgene in 24 hpf embryos. There are mCherry-positive nuclei in slow-twitch muscle (yellow arrows) and neural tube (yellow arrowheads). (K-M) Quantification of (K) the number of F59 stained fibers per segment in each genotype, (L) ventral migration of the NCC stream, and (M) mCherry intensity. For K and L, black dots represent individual segments and colored dots represent individual averages. Horizontal line in box plot indicates the median. Lower and upper edges of boxes indicate the first and third quartiles, respectively. Whiskers indicate minimum and maximum values. NT, neural tube; nc, notochord.