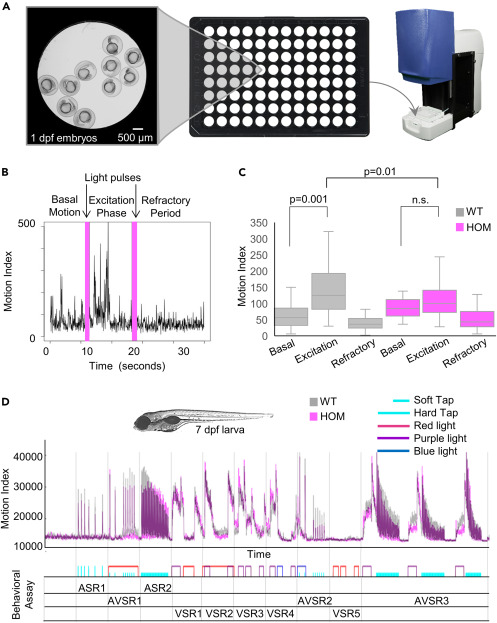
Fig. 2 disc1 mutant embryos and larvae display blunted behavioral responses to sensory stimuli (A) Overview of the photomotor response assay: Ten embryos (28 hpf) per well were loaded into 96-well plates and motion was measured using the ZebraBox. (B) Example motion index graph. For each well, basal motion was captured, followed by an excitation period induced by a light stimulus (denoted by a magenta vertical bar), and a refractory period in which a second light stimulus (denoted by a magenta vertical bar) did not elicit motion. (C) Box and whisker plot showing motion indexes for the basal, excitation, and refractory phases in WT (gray) and mutant (magenta) embryos (n = 48 wells per genotype). The box in the plot represents the 25th percentile to the 75th percentile, the line across the box represents the median, and the whiskers are the maximum and minimum data-point values. (D) Behavioral profile generated in 7 dpf larvae using a battery of sensory and acoustic stimuli demonstrating decreased motor output in disc1 mutants in response to auditory stimuli. Plot shows the average motion index of WT (gray) and disc1 mutant (magenta) larvae (8 larvae per well, 36 wells per genotype). The x-and y axes indicate time and the motion index, respectively. Behavioral assay names and their order in the run are indicated below the x axis. AS = auditory stimulus, VS. = visual stimulus and AV = auditory plus visual stimulus.
Image
Figure Caption
Figure Data
Acknowledgments
This image is the copyrighted work of the attributed author or publisher, and
ZFIN has permission only to display this image to its users.
Additional permissions should be obtained from the applicable author or publisher of the image.
Full text @ iScience

