
Image
|
Figure Caption
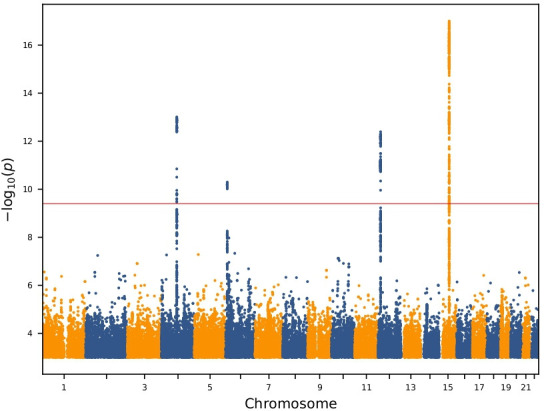
Fig. 1
Manhattan plot of the genome-wide analysis of erosive hand osteoarthritis The p values (−log10) are plotted against their respective positions on each chromosome. Results are shown for all variants with significance level p<0.001 and imputation information greater than 0.8.
Acknowledgments
This image is the copyrighted work of the attributed author or publisher, and
ZFIN has permission only to display this image to its users.
Additional permissions should be obtained from the applicable author or publisher of the image.
Full text @ Ann. Rheum. Dis.