IMAGE

FIGURE 7

ID
ZDB-IMAGE-230916-25
Source
Figures for DeMoya et al., 2023
Image
Figure Caption

FIGURE 7

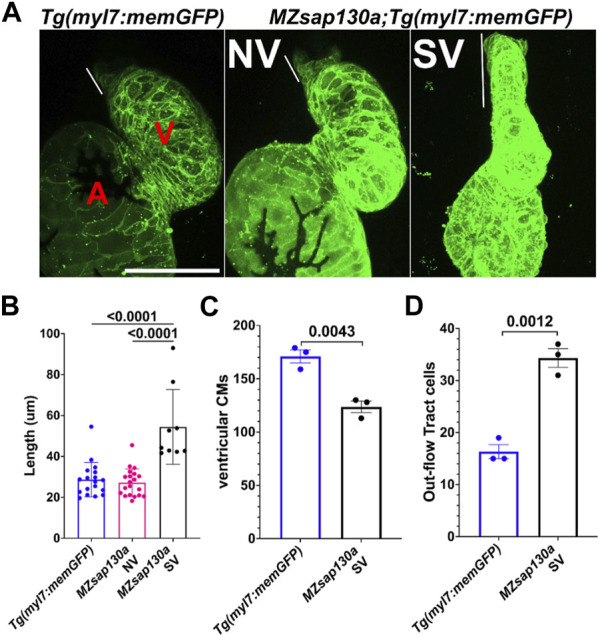
Tg(myl7:memGFP) reveals longer OFT by 72hpf in MZsap130a(A) Quantified OFT lengths at 72hpf, pval is from a one ANOVA, SEM error bars. Each point represents a single embryo, Tg(myl7:memGFP), n = 18; MZsap130a;Tg(myl7:memGFP) NV, n = 20; MZsap130a;Tg(myl7:memGFP) SV, n = 9 (B) Representative images of Tg(myl7:memGFP) and MZsap130a;Tg(myl7:memGFP), white lines demarcate OFT length, pvals from one way ANOVA, SEM error bars. (C)Tg(myl7:memGFP)+;H2b:mCherry + ventricular CM counts for three WT or MZsap130a SV heart, pval is from a t-test, SEM error bars (D)Tg(myl7:memGFP)+;H2b:mCherry + out-flow tract cell counts for three WT or MZsap130a SV heart, pval is from a t-test, SEM error bars. V and A are ventricle and atria, respectively. Scale bar 100 μm.

Figure Data
Acknowledgments
This image is the copyrighted work of the attributed author or publisher, and ZFIN has permission only to display this image to its users. Additional permissions should be obtained from the applicable author or publisher of the image. Full text @ Front Cell Dev Biol