IMAGE

FIGURE 5

ID
ZDB-IMAGE-230916-23
Source
Figures for DeMoya et al., 2023
Image
Figure Caption

FIGURE 5

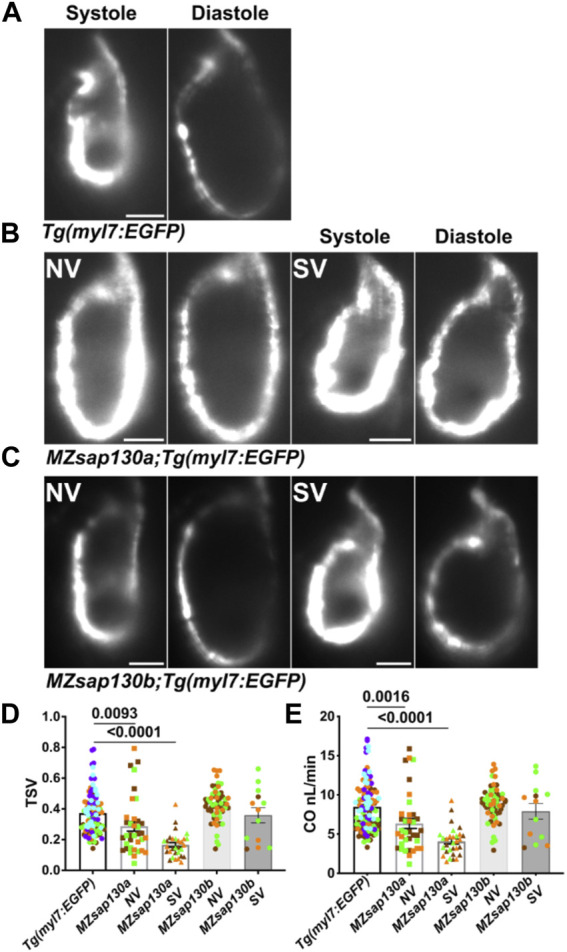
MZsap130a show cardiac functional deficits (A–C) Shows systole and diastole frames from recordings of live ventricular contractions in Tg(myl7:EGFP), MZsap130a;Tg(myl7:EGFP) and MZsap130b;Tg(myl7:EGFP) at 48hpf. (D, E) Quantified cardiac parameters total stroke volume (TSV) and cardiac output (CO), pvals from one-way ANOVA, error bars are SEM. Each point represents individual ventricle and color coded for 3+ experiments. For Tg(myl7:EGFP), n = 115; MZsap130a NV, n = 36; MZsap130a SV, n = 30; MZsap130b NV, n = 57; MZsap130b SV, n = 13. Scale bar 20 μm.

Figure Data
Acknowledgments
This image is the copyrighted work of the attributed author or publisher, and ZFIN has permission only to display this image to its users. Additional permissions should be obtained from the applicable author or publisher of the image. Full text @ Front Cell Dev Biol