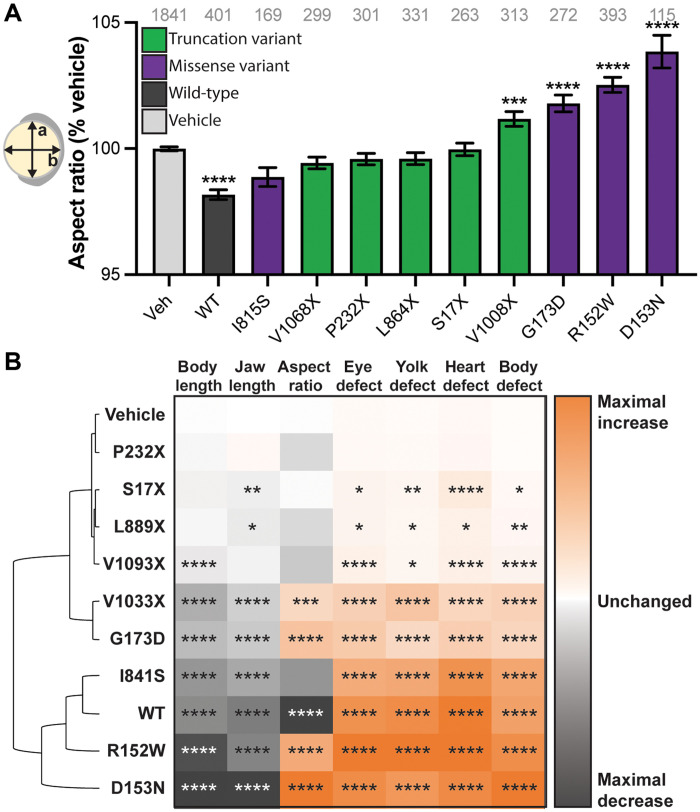
Fig. 5
(A) Aspect ratio was measured at 11 hours post fertilization (hpf) as the ratio of a divided by b, shown on the embryo schematic. WT and hypomorphic variants reduce the aspect ratio, loss-of-function (LOF) variants have no effect, and dominant-negative (DN) variants elongate the embryo. (B) Hierarchical clustering of the quantitative phenotypic metrics ranks DN alleles as closer to MAP4K4WT in phenotypic output than to loss of function alleles. The P value for each measurement is shown in the box, with the absence of symbols indicating nonsignificant changes. Graph: pale gray, vehicle; dark gray, MAP4K4WT; purple, missense variants; green, truncation variants. *P < 0.05; **P < 0.01; ***P < 0.001; ****P < 0.0001 by pairwise Student?s t test compared to vehicle. ANOVA gives P < 0.0001 for (A). n numbers are inset to graph in gray text. Error bars represent the SEM.

