IMAGE

Fig. 2

ID
ZDB-IMAGE-230915-29
Source
Figures for Vaparanta et al., 2023
Image
Figure Caption

Fig. 2

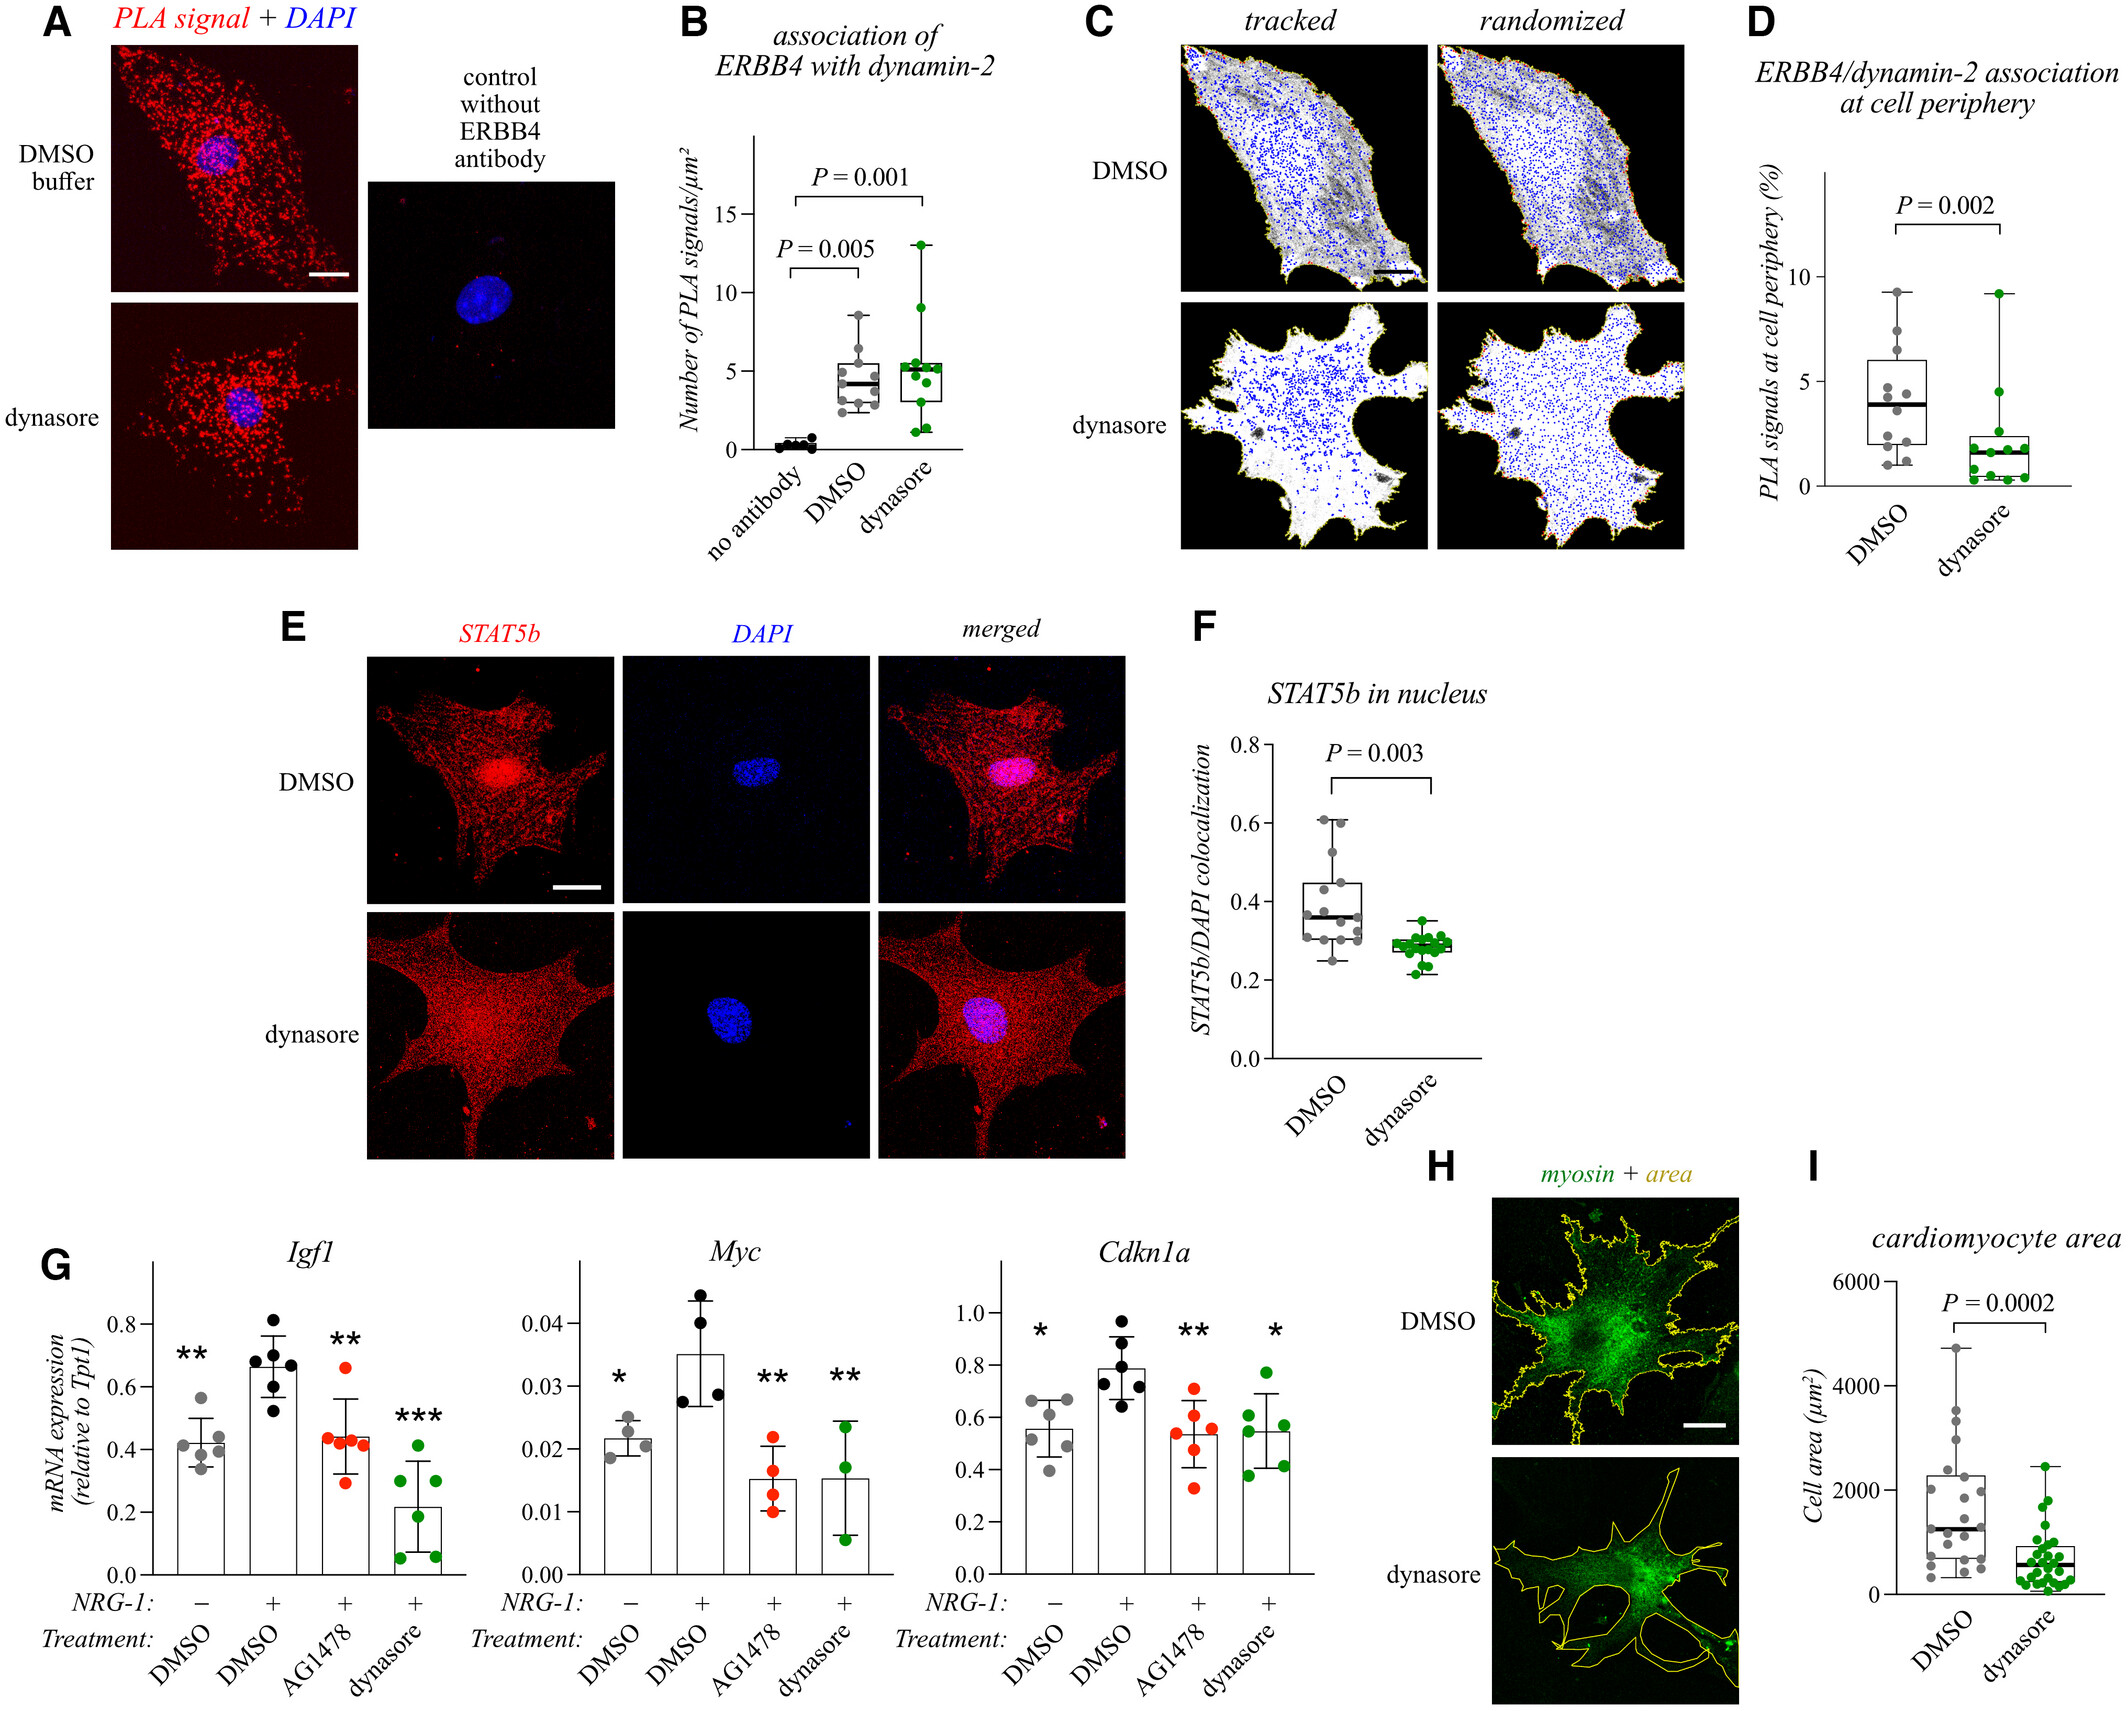
Figure 2. Dynamin-2 controls ERBB4 signaling and cardiomyocyte hypertrophy

  • A, B. Proximity ligation assay (PLA) of association of Dynamin-2 with ERBB4 in primary mouse cardiomyocytes treated with either DMSO or the dynamin inhibitor dynasore for 5 h. Panel A depicts a z projection of a stack of confocal images. PLA interactions are shown in red, nuclear stain DAPI in blue. Panel B depicts quantification of the data. One dot in the boxplot corresponds to the number of PLA signals in μm2 in one cell (Control: n = 6, DMSO buffer: n = 11, dynasore: n = 11; technical replicates from one of two biological replicate experiments). Non-parametric Kruskal-Wallis ANOVA and the Dunn's multicomparison test with multiple test correction was used for statistics. Scale bar 20 μm.
  • C, D. Analysis of the subcellular localization of the association of Dynamin-2 with ERBB4. Panel C depicts Dynamin-2/ERBB4 PLA interactions in blue in representative cells (tracked) as well as when the PLA signals were artificially randomly distributed throughout the area of the cell (randomized). Panel D depicts quantification of the PLA interactions within 1 μm distance from the edges of the cells (cell periphery). One dot in the boxplot corresponds to the fraction of PLA signals in the cell periphery in one cardiomyocyte (for each group n = 12; technical replicates combined from two biological replicate experiments). Non-parametric Mann–Whitney U-test was used for statistics. Scale bar 20 μm.
  • E, F. Confocal images I and quantification (F) of immunofluorescence staining of STAT5b and the nuclear stain DAPI in primary mouse cardiomyocytes. The cells were treated with either DMSO or dynasore for 5 h and stimulated for 15 min with NRG-1. Panel (F) depicts quantification of colocalization of STAT5b- and DAPI-specific signals. One dot in the boxplots corresponds to one cell (DMSO: n = 15, dynasore: n = 19; technical replicates combined from two biological replicate experiments). Non-parametric Mann–Whitney U-test was used for statistics. Scale bar 20 μm.
  • G. Real-time RT-PCR analysis of expression of the indicated STAT5b target genes in primary mouse cardiomyocytes treated for 1–3 h with the DMSO buffer, the ERBB kinase inhibitor AG1478, or dynasore, and stimulated or not for 30 min with NRG-1. One dot corresponds to the mean of technical replicates in one experiment and the whiskers the standard deviation (for each group in Igf-1 and Cdkn1a panel: n = 6, for each group expect the dynasore group in Myc panel: n = 4, for the dynasore group in Myc panel: n = 3; biological replicate experiments). One-way ANOVA and the Dunnett's multicomparison test with multiple test correction was used for statistics. *P < 0.05; **P < 0.01; ***P < 0.001; against DMSO + NRG-1 treatment (Igf-1 panel: DMSO without NRG-1 P = 0.0041, AG1478 P = 0.0082, dynasore P = 6.61e-06; Myc panel: DMSO without NRG-1 P = 0.0386, AG1478 P = 0.0037, dynasore P = 0.0064; Cdkn1a panel: DMSO without NRG-1 P = 0.0123, AG1478 P = 0.0064, dynasore P = 0.0092).
  • H, I. Confocal images (H) and quantification (I) of immunofluorescence staining of myosin heavy chain in primary mouse cardiomyocytes. The cells were treated with either DMSO or dynasore and stimulated with NRG-1 for 2 days. The myosin immunoreactivity was used to quantify cell area. One dot in the boxplot corresponds to one cell (DMSO: n = 22, dynasore: n = 28; technical replicates combined from three biological replicate experiments). Non-parametric Mann–Whitney U-test was used for statistics. Scale bar 20 μm.

Data information: For all boxplots the central band represents the median, the box the interquartile range and whiskers the whole range of values.

Source data are available online for this figure.

Acknowledgments
This image is the copyrighted work of the attributed author or publisher, and ZFIN has permission only to display this image to its users. Additional permissions should be obtained from the applicable author or publisher of the image. Full text @ EMBO Rep.