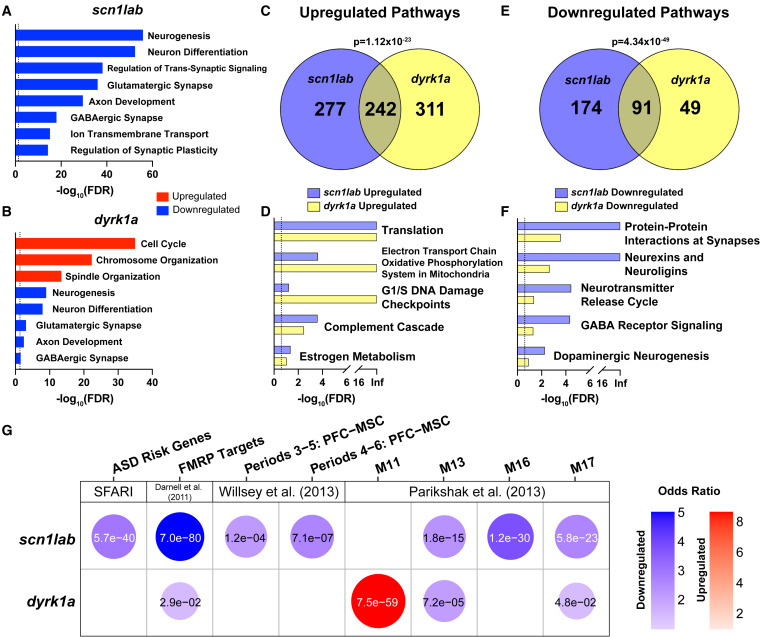
Fig. 6 Whole-brain RNA-seq identifies common dysregulated pathways in scn1lab and dyrk1a mutants
(A and B) Dysregulated GO pathways in scn1lab?44/?44 (A) and dyrk1aa?77/?77dyrk1ab?8/?8 (B) mutants. The dashed line represents FDR of less than 0.05. Pathways enriched in upregulated (red) or downregulated (blue) genes are shown. For a complete list of significant GO pathways, see Table S6.
(C?F) GSEA pathways upregulated (C and D) or downregulated (E and F) in both mutants. The dashed line represents FDR of less than 0.25. p values indicating significant overlap were calculated using Fisher?s exact test. For a complete list of significant GSEA pathways, see Table S6.
(G) Hypothesis-driven GSEA of DE genes (p < 0.1 and fold-change >1.5) in scn1lab?44/?44 and dyrk1aa?77/?77dyrk1ab?8/?8 mutants using the following datasets: SFARI ASD risk genes,32 FMRP targets,51 and human brain co-expression network modules.8,9 The top four modules from Parikshak et al. (2013) 9 based on combined p value in homozygous mutants using Fisher?s method are shown. Gene sets enriched in upregulated (red) or downregulated (blue) genes are shown. Bubbles are shown only for gene sets with significant enrichment (p < 0.05). The color intensity and size of each bubble represent the odds ratio. p-values calculated using Fisher?s exact test are shown in each bubble. For the complete GSEA including all co-expression network modules in homozygotes and heterozygotes, see Figures S6B and S6C.

