Fig. 7
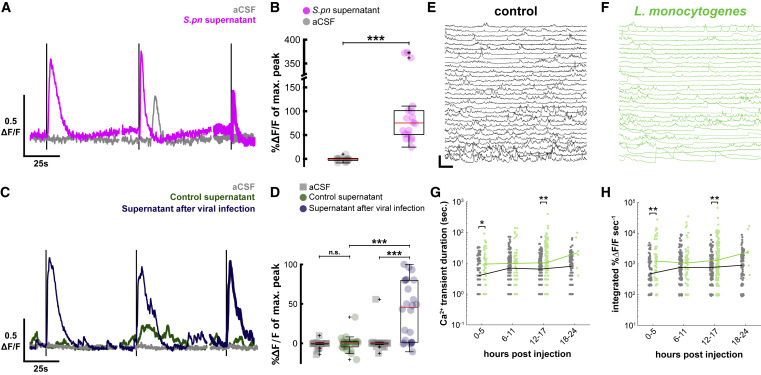
Figure 7. Streptococcus pneumoniae supernatant, virus culture supernatant, and Listeria monocytogenes infection also activate CSF-cNs (A) Representative individual in vitro CSF-cN Ca2+ traces from 3 successive 1-s stimulations of aCSF (gray) and supernatant (purple). Dark lines correspond to 1-s stimulations. Vertical scale, 0.5 ?F/F; horizontal scale, 25 s. (B) Quantification of calcium transients after aCSF (gray circle) or S. pneumoniae supernatant (purple circle) stimuli. Paired t test, p = 5.0 × 10?4, ???p < 0.001. Red bar: median ?F/F (median S. pneumoniae supernatant = +75.35% versus median aCSF = ?0.73%, n = 6 cells). Boxplot represents IQR + minimum/maximum sans outliers. (C) Representative individual in vitro CSF-cN Ca2+ traces from 3 successive 1-s stimulations of aCSF (gray), UV-inactivated supernatant of BHK cells infected with Sindbis virus (blue), and control BHK supernatant (green). Dark lines correspond to 1-s stimulations. Vertical scale, 0.5 ?F/F; horizontal scale, 25 s. (D) Quantification of calcium transients after aCSF (gray circle), control supernatant (green circle), or supernatant after viral infection (blue) stimuli. Two-factor ANOVA, treatment factor F = 24.52, p = 3.32 × 10?6, Tukey HSD post hoc testing, ???p < 0.001. Red bar: median ?F/F (median control supernatant = +0.82% versus median aCSF = ?0.26%, n = 8 cells; median supernatant after virus infection = 45.63% versus median SF = ?0.22%, n = 7 cells; median 100 mM DMDS = 112.09% versus median aCSF = ?0.54%, n = 8 cells. (E) In vivo Ca2+ activity of CSF-cNs in uninfected larvae 8 h after injection in the brain ventricle. Vertical scale, 250% ?F/F; horizontal scale, 20 s. (F) Long-lasting and large calcium transients from larvae infected with L. monocytogenes occur in a similar manner as with S. pneumoniae. (G) Quantification of duration of software-detected high-amplitude transients in control (gray) and L. monocytogenes-infected (green) larvae (Wilcoxon signed-rank test, ?p < 0.0125, ??p < 0.0063). Lines indicate median values. (H) Similar quantification of integrated signal of large transients during L. monocytogenes infection. See also Table S1.
Image
Figure Caption
Acknowledgments
This image is the copyrighted work of the attributed author or publisher, and
ZFIN has permission only to display this image to its users.
Additional permissions should be obtained from the applicable author or publisher of the image.
Full text @ Curr. Biol.

