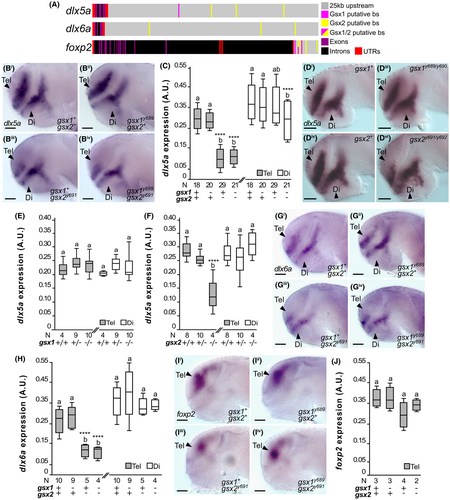
Fig. 9 Regulation of dlx5a, dlx6a, and foxp2 by Gsx1 and Gsx2. (A) Schematic of Gsx1 and 2 putative binding sites (putative bs) upstream of the zebrafish dlx5a, dlx6a, and foxp2 gene bodies. (Bi-Biv) dlx5a expression at 30 hpf in wild type, gsx1y689, gsx2y691, and gsx1y689;gsx2y691 zebrafish. Images are ×20 compound scope images with samples mounted under cover glass, eyes dissected, and anterior facing left. Scale bar = 50 ?m. (C) Quantification of dlx5a expression from experiment shown in (B) panels. Sample sizes for all FIJI-ImageJ analyses are indicated. Different letters represent significant differences and asterisks correspond with P-values; *P < .05, **P < .01, ***P < .005, ****P < .001. (Di-Div) dlx5a expression at 30 hpf in wild type, gsx1y689/y690 mutants and gsx2y691/y692 mutants. (E). Quantification of dlx5a expression in gsx1y689/y690 mutants experiment in (D) panels. (F) FIJI-ImageJ quantification of dlx5a expression in gsx2y691/y692 mutants experiment shown in (D) panels. (G) dlx6a expression at 30 hpf in wild type, gsx1y689, gsx2y691, and gsx1y689;gsx2y691 zebrafish. (H) Quantification of dlx6a expression in (G) panels. (Ii-Iiv) foxp2 expression at 30 hpf in wild type, gsx1y689, gsx2y691, and gsx1y689;gsx2y691 zebrafish. (J) Quantification of foxp2 expression in (I) panels experiment
Image
Figure Caption
Figure Data
Acknowledgments
This image is the copyrighted work of the attributed author or publisher, and
ZFIN has permission only to display this image to its users.
Additional permissions should be obtained from the applicable author or publisher of the image.
Full text @ Dev. Dyn.

