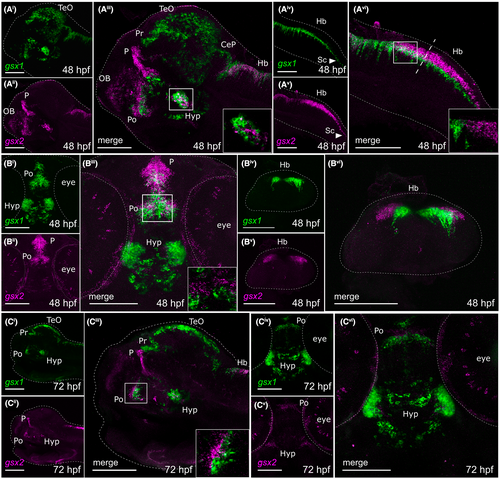
Fig. 5 Fluorescence in situ hybridization confirms minimal co-localization of gsx1 and gsx2 during late embryonic and early larval development. (Ai-Avi) Lateral views showing expression of gsx1 and gsx2 at 48 hpf. (Bi-Bii) Ventral views showing expression of gsx1 and gsx2 at 48 hpf. (Biv-Bvi) Cross-sectional view taken at the dashed line in Avi. (Ci-Ciii) Lateral view showing gsx1 and gsx2 expression at 72 hpf. (Civ-Cvi) Ventral view showing gsx1 and gsx2 expression at 72 hpf. Lateral views were taken at ×20 and ventral/Cross-sectional views were taken at ×40, all with anterior facing left. All were pseudocolored using FIJI ImageJ and scale bars represent 100 ?m. For lateral views, eyes were dissected off. Main images are max z-projections and insets are single z-stack slices zoomed into the boxed region shown in the main image. CeP, cerebellar plate; Di, diencephalon; Hb, hindbrain; Hyp, hypothalamus; Mb, midbrain; OB, olfactory bulb; P, pallium; Po, preoptic area; Pr, pretectum; Sc, spinal cord; Tel, telencephalon; TeO, optic tectum
Image
Figure Caption
Figure Data
Acknowledgments
This image is the copyrighted work of the attributed author or publisher, and
ZFIN has permission only to display this image to its users.
Additional permissions should be obtained from the applicable author or publisher of the image.
Full text @ Dev. Dyn.

