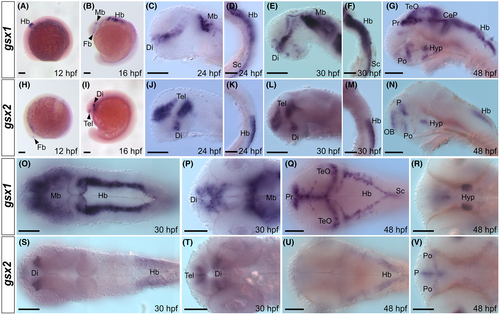
Fig. 2 Expression of gsx1 and gsx2 in embryonic zebrafish is dynamic and unique. (A-G) Lateral mounts showing expression of gsx1 from 12 to 48 hpf. (H-N) Lateral mounts showing expression of gsx2 from 12 to 48 hpf. (O-R) Dorsal (O and Q) and ventral (P and R) mounts showing expression of gsx1 from 30 to 48 hpf. (S-V) Dorsal (S and U) and ventral (T and V) mounts showing expression of gsx2 from 30 to 48 hpf. A, B, H, and I are dissecting scope images and scale bar represents 500 ?m. Remaining images are compound scope images taken at ×20 with samples mounted under cover glass and anterior facing left, eyes removed in lateral views. Scale bars represent 100 ?m. CeP, cerebellar plate; Di, diencephalon; Fb, forebrain; Hb, hindbrain; Hyp, hypothalamus; Mb, midbrain; OB, olfactory bulb; P, pallium; Po, preoptic area; Pr, pretectum; Sc, spinal cord; Tel, telencephalon; TeO, optic tectum
Image
Figure Caption
Figure Data
Acknowledgments
This image is the copyrighted work of the attributed author or publisher, and
ZFIN has permission only to display this image to its users.
Additional permissions should be obtained from the applicable author or publisher of the image.
Full text @ Dev. Dyn.

