Fig. 7
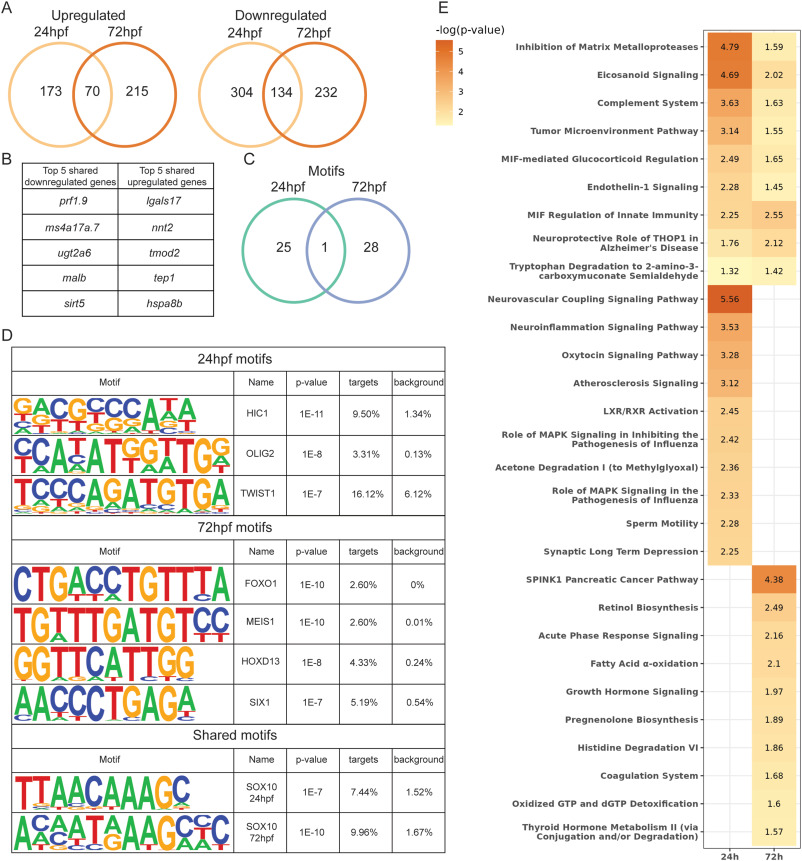
Fig. 7. Development and cancer genes and pathways are impacted by her3 null mutation. (A) Venn diagram showing overlap of differentially expressed genes from her3 null mutant between 24hpf and 72hpf embryos. (B) List of the top 5 up- and downregulated genes shared between 24hpf and 72hpf in the her3 null mutant. (C) Venn diagram of transcription factors with DNA binding motifs overlapping between 24hpf and 72hpf her3 null mutant embryos. Targets are the percentage of differentially expressed genes that contain the motif. Background is the percentage of non-differentially expressed genes that contain the motif. (D) Examples of motifs from Venn diagram in (C). (E) p-value chart showing IPA pathways that are significantly enriched with identified differentially expressed genes.
Reprinted from Developmental Biology, 496, Kent, M.R., Calderon, D., Silvius, K.M., Kucinski, J.P., LaVigne, C.A., Cannon, M.V., Kendall, G.C., Zebrafish her3 knockout impacts developmental and cancer-related gene signatures, 1141-14, Copyright (2023) with permission from Elsevier. Full text @ Dev. Biol.

