Image
Figure Caption
Fig. 3
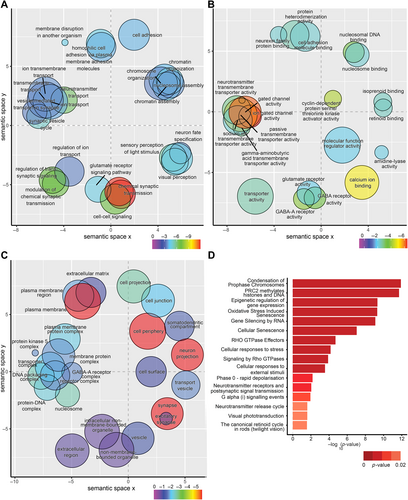
Gene ontology (GO) overrepresentation analysis of differentially expressed genes in crb2a?/? retina. Scatter plots of ontology enrichment analysis coloured by log10(p-value) scores plotted in semantic space. The size of each point represents the number of genes overlapping the ontology, scaled. Multidimensional scaling (MDS) was used to reduce the dimensionality of the resulting GO terms? semantic similarities, with the closeness in the plot reflecting the closeness in the GO directed acyclic graph structure. Thus, semantically similar terms should remain close together in the plot. (A) Biological process (GO:BP) ontology analysis, (B) molecular function (GO:MF) analysis, (C) cellular component (GO:CC), and (D) REACTOME pathway analysis.
Acknowledgments
This image is the copyrighted work of the attributed author or publisher, and
ZFIN has permission only to display this image to its users.
Additional permissions should be obtained from the applicable author or publisher of the image.
Full text @ J. Pathol.

