
Image
|
Figure Caption
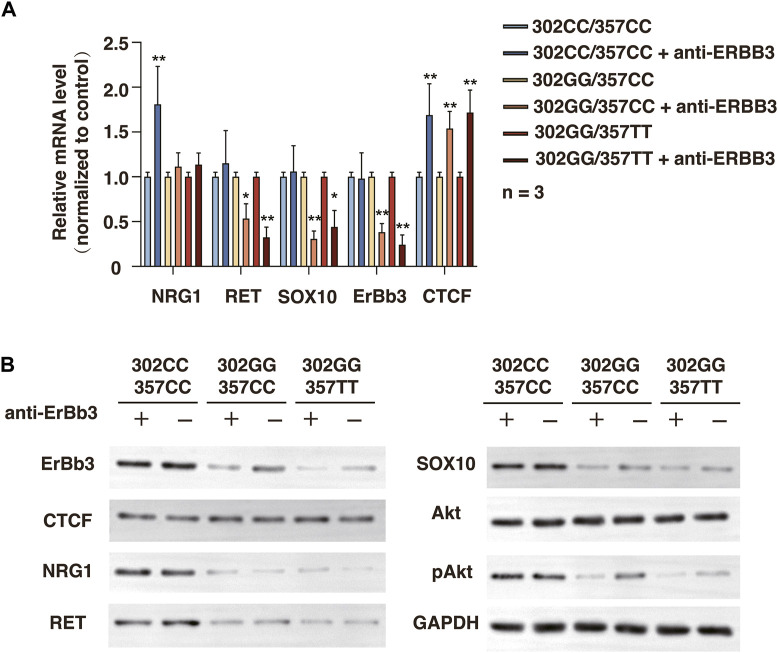
FIGURE 6
Related protein expression changes after ERBB3 neutralization antibody intervention in SHSY-5Y cells with different genotype. (A) qRT-PCR analysis of relative expression levels of NRG1, RET, SOX10, ERBB3, and CTCF. (B) Western blot of protein expression levels of NRG1, RET, SOX10, ERBB3, CTCF, Akt, pAkt, and GAPDH.
Acknowledgments
This image is the copyrighted work of the attributed author or publisher, and
ZFIN has permission only to display this image to its users.
Additional permissions should be obtained from the applicable author or publisher of the image.
Full text @ Front Cell Dev Biol