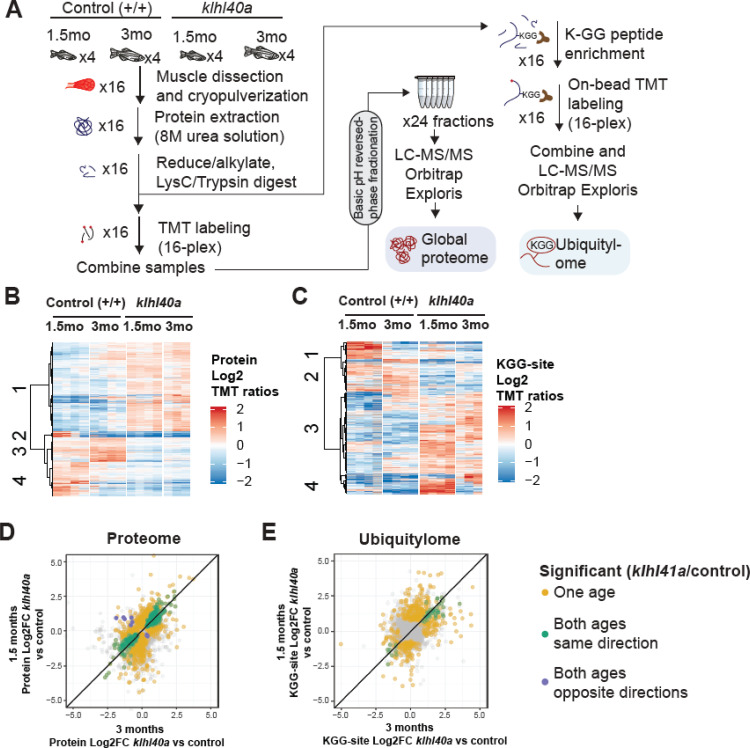
Figure 3 Proteome and ubiquitylome disruption by Klhl40a deficiency. (A) Experimental workflow for proteome and ubiquitylome quantification in klhl40a allele. (B) Heatmap showing protein abundances (log2 TMT ratios) across experimental samples. Only proteins with a significant differential response between control and klhl40a KO samples are shown (adjusted P-value <0.05). Proteins (rows) were clustered to show abundance patterns across experimental groups. (C) Heatmap showing ubiquitin sites following trypsin digestion (KGG)-site abundances (log2 TMT ratios) across experimental samples. Only proteins with a significant differential response between control and klhl40a KO samples are shown (adjusted P-value <0.05). KGG sites (rows) were clustered to show abundance patterns across experimental groups. (D) Correlation of protein response to klhl40a KO across juvenile (1.5 months) and adult animals (3 months). Plots show log2 fold changes for proteins quantified at both ages. Proteins are colored if they show differential abundance (adjusted p-value <0.05) at one age only (yellow), both ages with the same direction (green), and both ages with opposite directions (purple). (E) Correlation of ubiquitylome response to klhl40a KO across juvenile (1.5 months) and adult animals (3 months). Plots show log2 fold-changes for KGG-sites quantified at both ages. KGG sites are colored if they show differential abundance (adjusted p-value <0.05) at one age only (yellow), both ages with the same direction (green), and both ages with opposite directions (purple).
Image
Figure Caption
Acknowledgments
This image is the copyrighted work of the attributed author or publisher, and
ZFIN has permission only to display this image to its users.
Additional permissions should be obtained from the applicable author or publisher of the image.
Full text @ Elife

