Fig. 2
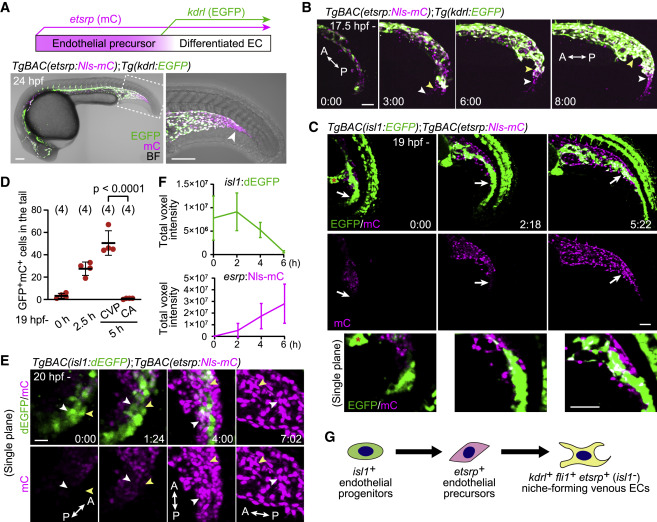
Figure 2. Identification of isl1+ endothelial progenitors as a source of ECs in the CHT (A) Visualization of etsrp:mCherry+ endothelial precursors (magenta) and their differentiation into kdrl:EGFP+ ECs (green, upper). TgBAC(etsrp:Nls-mCherry);Tg(kdrl:EGFP) embryo at 24 hpf (lower). The boxed area is enlarged on the right. mCherry single-positive endothelial precursors are observed in the most posterior region of the tail (arrowhead). (B) Time-sequential images of a TgBAC(etsrp:Nls-mCherry);Tg(kdrl:EGFP) embryo (from 17.5 hpf). Elapsed time (h:min). etsrp:mCherry+ endothelial precursors in the most posterior region of the tail differentiate into kdrl:EGFP+ ECs (arrowheads point to individual cells). (C) Time-sequential images of a TgBAC(isl1:EGFP);TgBAC(etsrp:Nls-mCherry) embryo (from 19 hpf). Elapsed time (h:min). Top and middle, projection view images; bottom, enlarged single confocal plane images of the regions pointed to by arrows. isl1:EGFP+ cells on the ventral side of the tail that do not initially express etsrp:mCherry differentiate into etsrp:mCherry+ endothelial precursors (arrows). isl1:EGFP is also detected in the presumptive cloaca (red asterisk) and neural tube. (D) Quantitative analysis of the data shown in (C). The number of isl1:GFP/etsrp:Nls-mCherry double-positive cells in the ventral region of the tail was counted at the indicated time (from 19 hpf). The double-positive cells were separately counted in the CA and the CVP only at 5 h because the CA and the CVP are indistinguishable until then (i.e., 24 hpf). Data are mean ± SD. (E) Time-sequential images of a TgBAC(isl1:dEGFP);TgBAC(etsrp:Nls-mCherry) embryo (from 20 hpf). Single confocal planes that contain the two tracked cells (white and yellow arrowheads) are shown. (F) Quantitative analysis of the data shown in (E). Time trace of the total voxel intensity of isl1:dEGFP or etsrp:Nls-mCherry in the ventral region of the tail. Data are mean ± SD (n = 3). (G) Schematic of differentiation of isl1+ endothelial progenitors. isl1+ endothelial progenitors exclusively differentiate into caudal venous ECs via etsrp+ endothelial precursors. Scale bars, 50 ?m. BF, bright field; A, anterior; P, posterior. See also Figure S2 and Videos S2, S3, and S4.
Reprinted from Developmental Cell, 58(3), Nakajima, H., Ishikawa, H., Yamamoto, T., Chiba, A., Fukui, H., Sako, K., Fukumoto, M., Mattonet, K., Kwon, H.B., Hui, S.P., Dobreva, G.D., Kikuchi, K., Helker, C.S.M., Stainier, D.Y.R., Mochizuki, N., Endoderm-derived islet1-expressing cells differentiate into endothelial cells to function as the vascular HSPC niche in zebrafish, 224-238.e7, Copyright (2023) with permission from Elsevier. Full text @ Dev. Cell

