
|
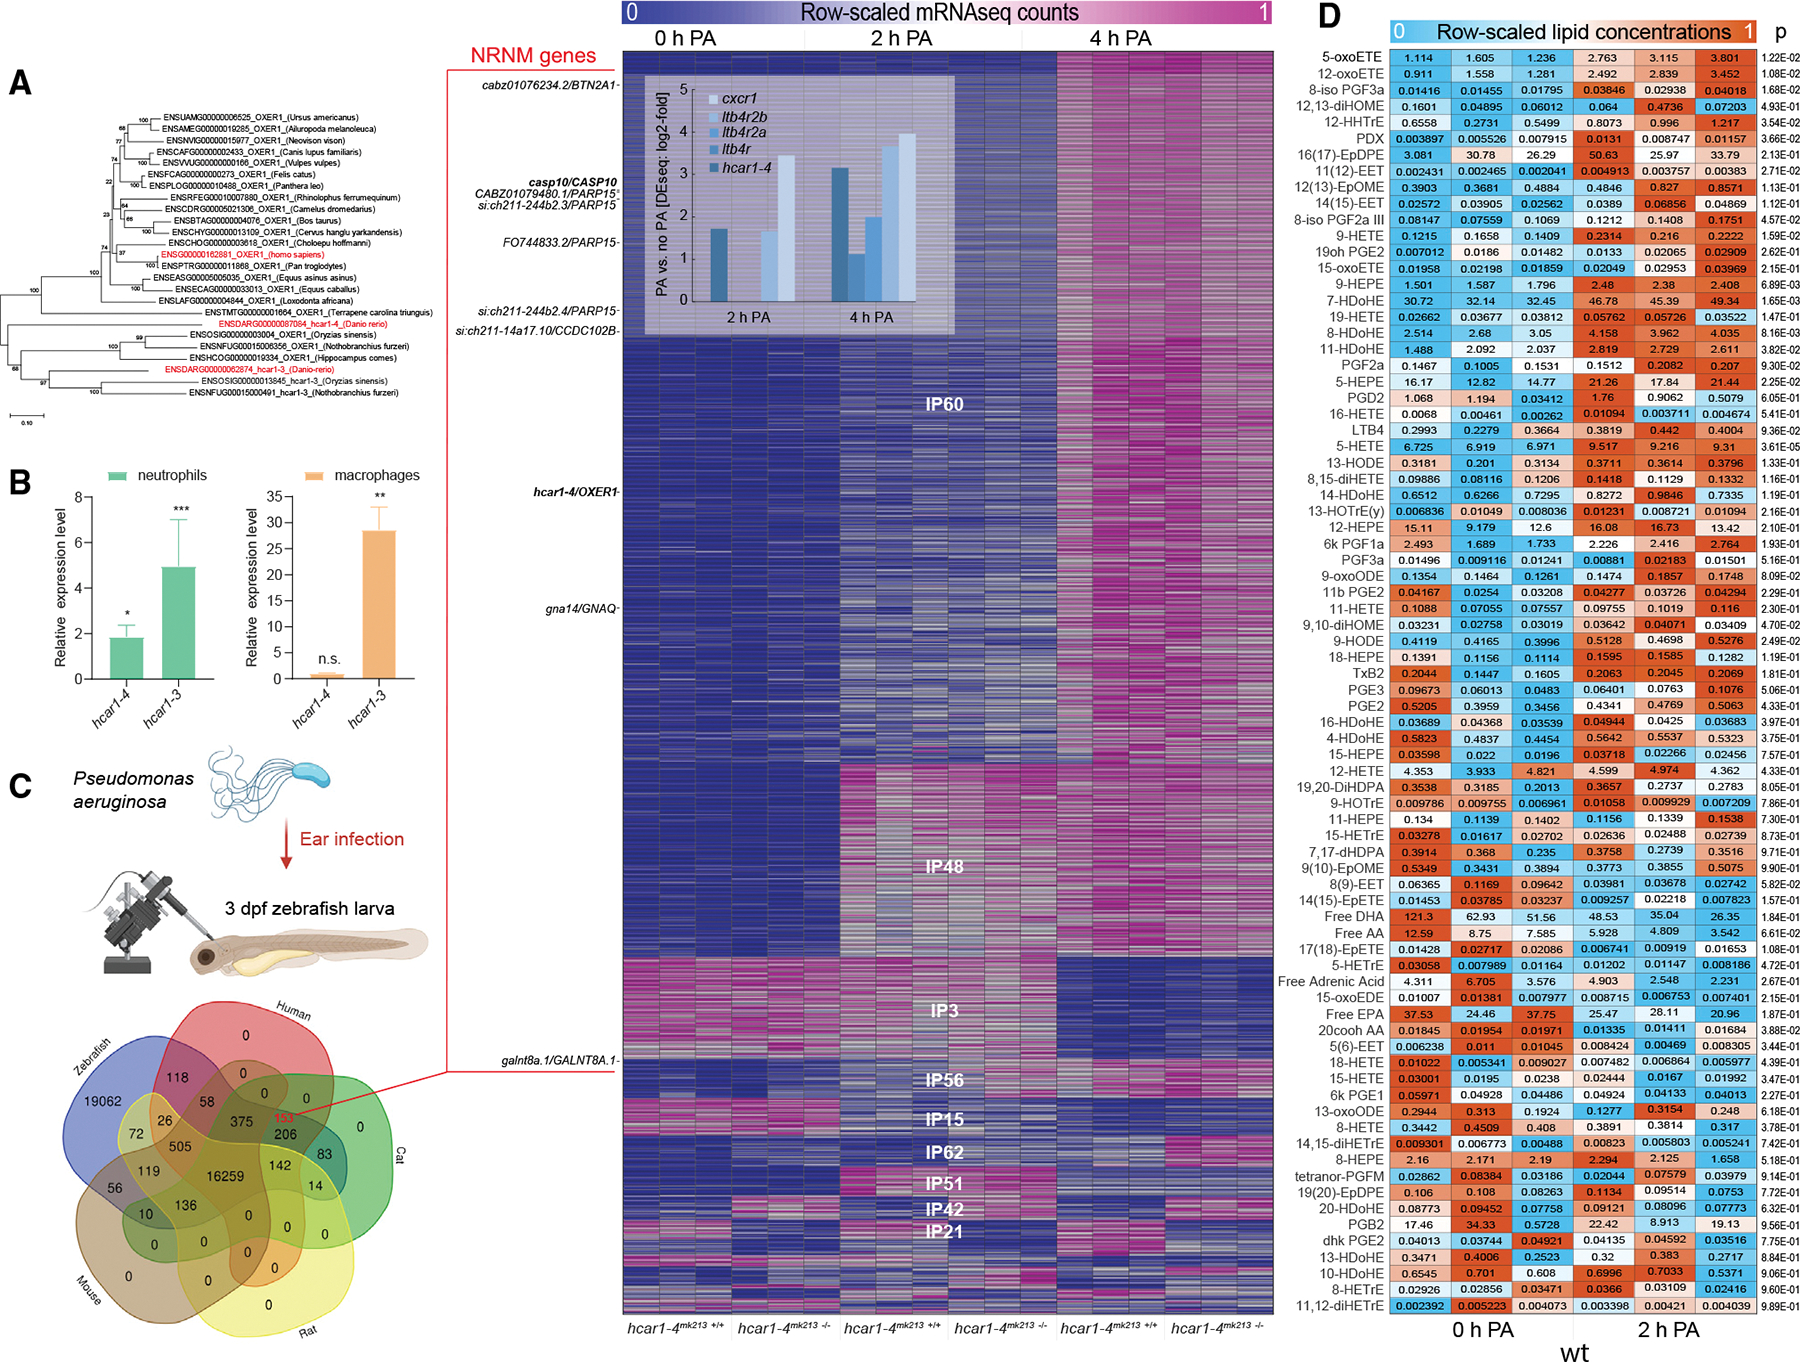
Fig. 1
(A) OXER1 phylogenetic tree.
(B) Relative expression levels of hcar1?3 and hcar1?4 mRNA in leukocytes compared with the rest of the body determined by FACS-sorting of dissociated neutrophil (left panel, TG(lyz:pm2-mk2)) or macrophage (right panel, TG(mpeg1: eGFP)) reporter zebrafish larvae and qRT-PCR. Error bars, SD of three different pools of zebrafish leukocytes. *p < 0.05, **p < 0.01, ***p < 0.001, n.s., p > 0.05; Student?s t test (two tailed, two sample unequal variance test).
(C) Top left panel: experimental cartoon scheme. This figure was created with BioRender. Bottom left panel: Venn diagram of zebrafish genes with ENSEMBL orthologs (ENSEMBL release 107) in human, cat, mouse, and rat. Red number, number of DIOPT-filtered NRNM genes (see STAR Methods). Right panel: sorted sGCA heatmap of significantly regulated mRNA-seq expression profiles (fold-regulation > 2, padj < 0.05 by Benjamini and Hochberg method) with high similarity to the respective binary expression phenotypes (correlation distance < 0.25, Figure S1B, also see STAR Methods and MATLAB sGCA script). Color scale, mRNA-seq profiles are row-scaled between 0 (blue) and 1 (pink). Shown are three biological replicates per experimental condition. Heatmap inset: significant (padj < 0.05) fold-upregulation of select inflammatory receptor mRNAs 2 and 4 h after PA infection as calculated by DEseq2. DIOPT-filtered NRNM genes are marked on the left side of the heatmap (zebrafish gene/human ortholog). NRNM genes with ?high?-ranked (criteria see STAR Methods) human orthologs are printed in bold.
(D) Heatmap of row-scaled lipid concentrations as measured by LIPIDMAPS full panel eicosanoid mass spectroscopical analysis. Color scale, relative lipid concentrations are row-scaled between 0 (blue) and 1 (orange). Boxed numbers, absolute lipid concentrations in pmol/mg tissue (~?M). Note that the color scale does not represent these absolute lipid concentrations, but that it highlights the relative changes for each lipid. Shown are three biological replicates (i.e., ~400 3 dpf zebrafish larvae per pool) per experimental condition. Numbers right of heatmap, p values of Student?s t test (two tailed, two sample unequal variance test) comparing 0 h PA vs. 2 h PA.
See also Figure S1 and Tables S1 and S2.