
|
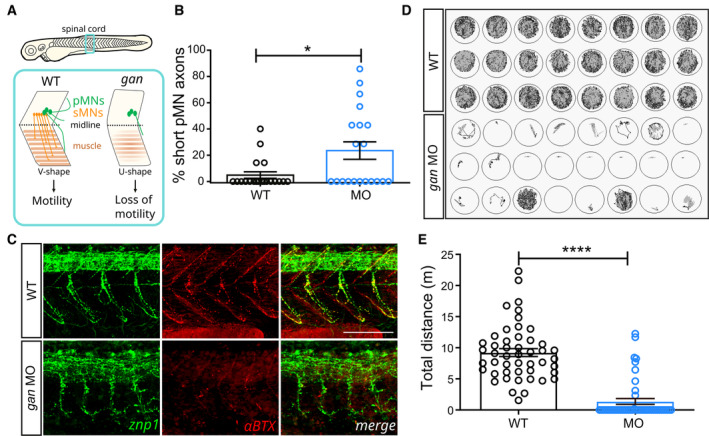
Figure 1
The
Schematic of the behavioral and cellular defects described in the The percentage of shorter pMN axons (< 70 μm) per fish is significantly higher in Representative images for the neuromuscular junctions (znp1: green; αBTX: α‐bungarotoxin: red) in WT and Representation of the cumulative tracking of the spontaneous locomotion of 5‐day‐old larvae for 1 h, in noninjected and MO‐injected animals. Quantitative measures of the traveled distance (m: meter) show total loss of locomotion in 79.2% of
Data information: (B, E) Each dot represents individual larvae; *