
Image
|
Figure Caption
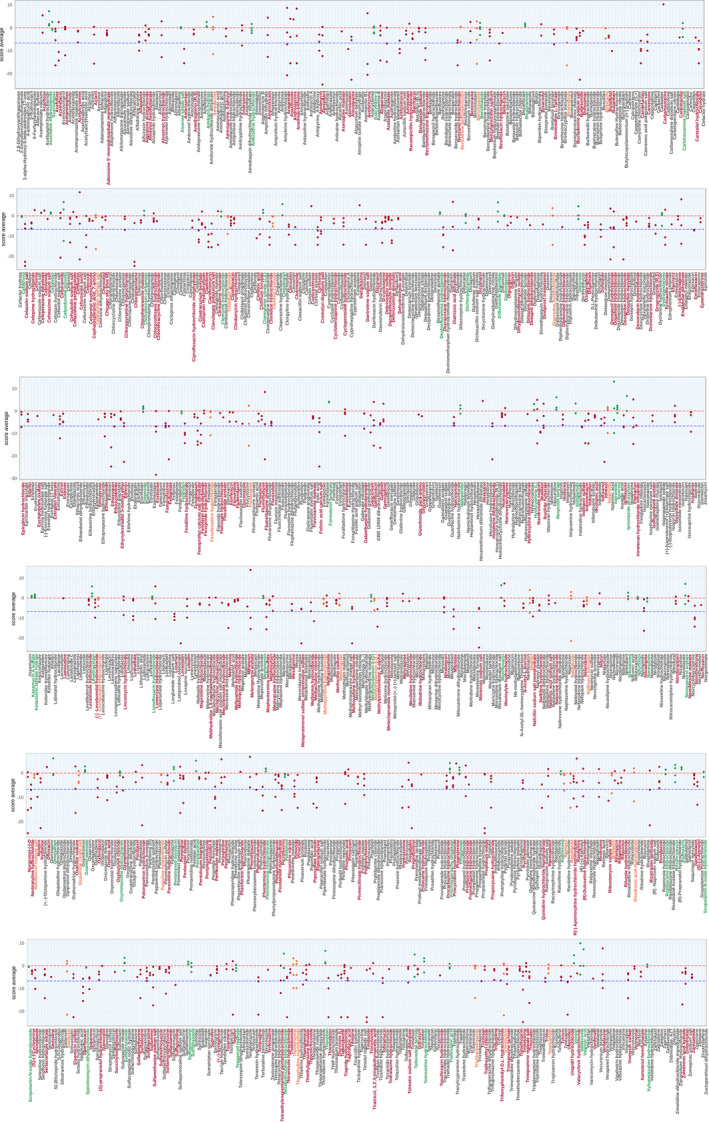
Figure EV2 Exhaustive representation of the z‐scores obtained in the Screen for the 1,280 compounds
For each drug, individual z‐scores of quadruplicate fish are plotted and assessed for the total distance traveled at 5 dpf by
Acknowledgments
This image is the copyrighted work of the attributed author or publisher, and
ZFIN has permission only to display this image to its users.
Additional permissions should be obtained from the applicable author or publisher of the image.
Full text @ EMBO Mol. Med.