IMAGE

Fig. 2

ID
ZDB-IMAGE-230710-11
Source
Figures for Deng et al., 2023
Image
Figure Caption

Fig. 2

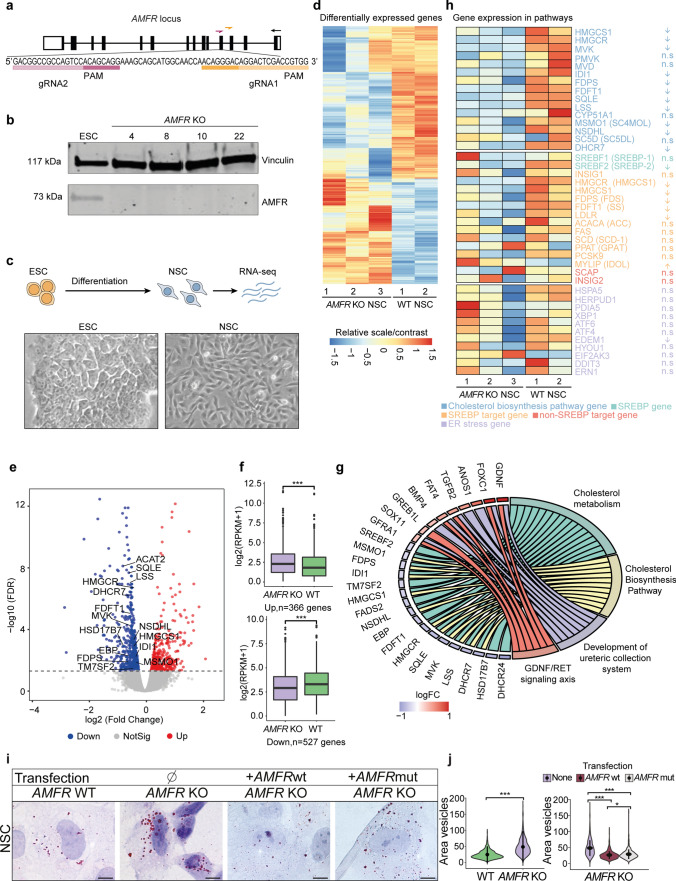
AMFR knockout neural stem cells show defects in cholesterol metabolism. a Schematic representation of the AMFR gene at chromosome 16q12.2. Filled boxes represent exons. Zoom-in shows the target sequence and gRNAs used to generate the AMFR KO ESCs. b Western blotting detecting AMFR (117 kDA) in wild-type H9 ESCs and AMFR KO ESC clones 4, 8, 10, and 22. Vinculin is used as a housekeeping control. Uncropped full-length Western blot is shown in Supplementary Fig. 5c. c Scheme showing the experimental outline and representative bright-field images of ESCs and differentiated NSCs. d Scaled heatmap depicting the RPKM gene expression from RNA-seq analysis of the 366 upregulated and 566 downregulated differentially expressed genes (FDR < 0.05) between wild type and AMFR KO NSCs. e Volcano plot showing log2 fold change and -log10(FDR) of the 366 upregulated and 566 downregulated differentially expressed genes between wild type and AMFR KO NSCs. Labels indicate selected genes. f Box plots showing the RNA-seq gene expression levels (log2(RPKM + 1) for the 366 upregulated and 566 downregulated genes in wild type and AMFR KO NSCs. Boxes represent the interquartile range (IQR); lines represent the median; whiskers extend to 1.5 × the IQR; dots represent outliers. (Wilcoxon test, *** p < 0.001). g GOChord plot of enrichment analysis, with the top-2 upregulated and downregulated terms from Wiki pathways, respectively. The left side of the GOChord diagram represents logFC, and the right side represents different terms of enrichment. The connecting bands indicate the corresponding pathways for each gene. h Scaled heatmap showing the RPKM gene expression levels for selected cholesterol biosynthesis pathway genes (blue), SREBP-1 and SREBP-2 (green), SREBP target genes (orange), non-SREBP target genes involved in cholesterol metabolism (red), and genes involved in ER stress response (purple). i Representative images of ORO staining detecting lipid droplets in wild type and AMFR KO NSCs, and in AMFR KO NSCs transfected with plasmids expressing wild-type AMFR or a RING mutant AMFR. Scale bars = 10 µm. j Quantification of the lipid droplet size from ORO staining from i). Violin plots showing the area of the quantified droplets in pixels and the distribution of the data. Data in the right plot are obtained from 2 wild-type NSCs (green colored) and 3 AMFR KO NSCs (purple colored) (biological replicates), cultured and stained each in two technical replicates, assessing n ≥ 400 droplets for each sample. Data in the left plot show the same quantification of the rescue experiments, where KO NSCs were transfected with a plasmid expressing wild type AMFR (brown) or a RING mutant AMFR (gray). Black circles, median; black line, SD (Kruskal–Wallis test for WT vs KO NSCs, Dunn’s Multiple Comparison test for the rescue experiment, *p < 0.05; ***p < 0.001)

Acknowledgments
This image is the copyrighted work of the attributed author or publisher, and ZFIN has permission only to display this image to its users. Additional permissions should be obtained from the applicable author or publisher of the image. Full text @ Acta Neuropathol.