IMAGE

Figure 2

ID
ZDB-IMAGE-230707-99
Genes
Antibodies
Source
Figures for Hu et al., 2023
Image
Figure Caption

Figure 2

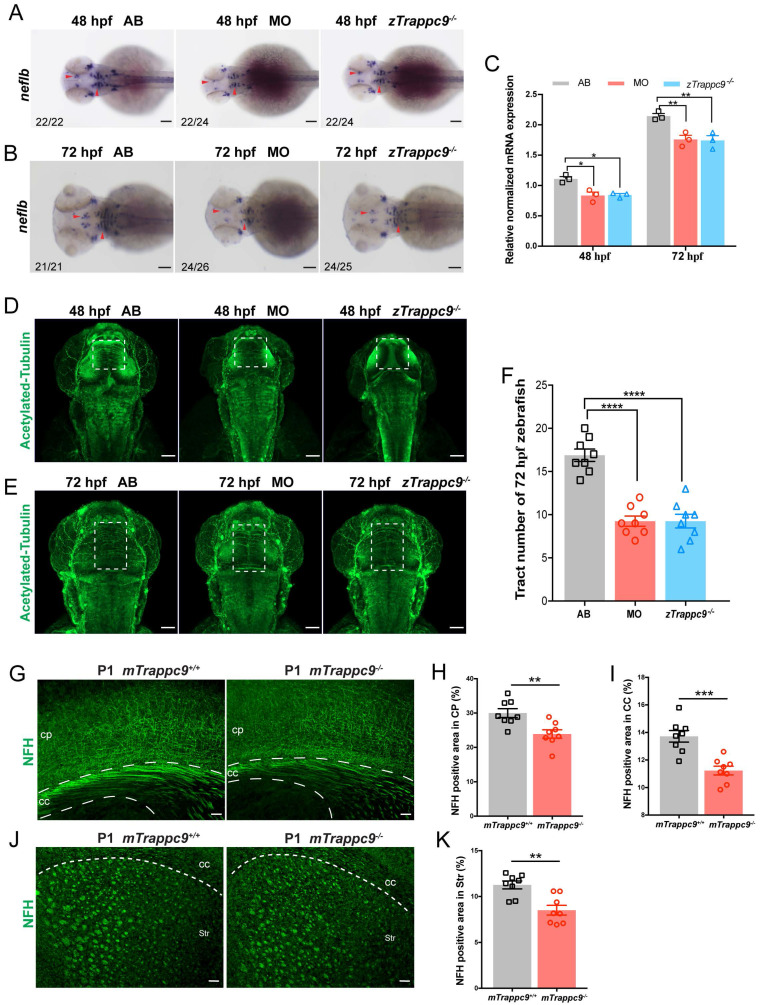
The axonal tracts of early developing mice and zebrafish are reduced after Trappc9 loss-of-function. (A-C), RNA in situ hybridization and RT-qPCR analysis of neflb mRNA expression in mutant (zTrappc9m/m) and morphant (MO) zebrafish embryos at 48 and 72 hpf. The red arrowheads point to the expression of neflb in the midbrain and hindbrain of zebrafish embryos. Both showed a decrease of neflb mRNA in MO and zTrappc9m/m zebrafish embryos. Representative images from n=20-26 embryos/group in 7 experiments (A, B); n=3 experiments (C). (D-F), Acetylated-α-tubulin immunostaining of zebrafish embryos at 48 and 72 hpf to label axonal tracts. The dotted square lines indicate intertectal fascicles and commissures. (F) Statistical analysis of the number of internal fascicles and commissure of zebrafish at 72 hpf in (E). The number of axonal tracts in MO and zTrappc9m/m zebrafish were significantly reduced compared to wildtype AB line. Representative images from n=10 embryos/group in 4 experiments (D, E); n= 8 embryos (F). (G-K), NFH immunostaining of neonatal mouse cerebral cortex (CP)/corpus callosum (CC), and striatum (Str). The axonal tracts of mTrappc9m/m mice were significantly fewer than mTrappc9+/+ mice in CP (H), CC (I) and Str (K). Representative images from n=4 mice/group (G, J); n=8 sections (H, I, K). Data are means ± SEM; t-tests (H, I, K); One-way ANOVA (F); Two-way ANOVA (C); ****P≤0.0001; ***P≤0.001; **P≤0.01; *P≤0.05; Scale bars: 50 μm (A, B, D, E, G, J).

Figure Data
Acknowledgments
This image is the copyrighted work of the attributed author or publisher, and ZFIN has permission only to display this image to its users. Additional permissions should be obtained from the applicable author or publisher of the image. Full text @ Int. J. Biol. Sci.