IMAGE

Figure 1

ID
ZDB-IMAGE-230707-98
Source
Figures for Hu et al., 2023
Image
Figure Caption

Figure 1

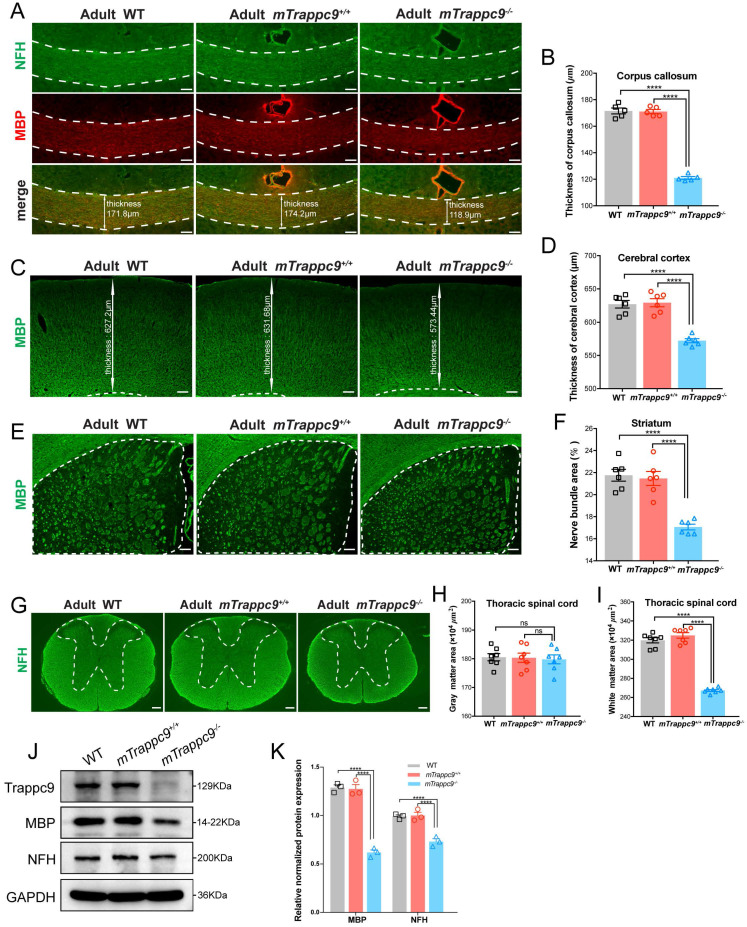
White matter and cerebral cortex are reduced in adult mTrappc9 deficient mice. (A-B), NFH (axonal tracts) and MBP (myelin) immunostaining of the corpus callosum sections. Compared with WT (C57BL/6 wildtype) and mTrappc9+/+, the corpus callosum (highlighted with white dotted lines) of mTrappc9m/m mice was significantly thinner. Representative images with indicated thickness from n=3 mice/group (A), and quantitative analysis of n=5 sections (B). (C-D), MBP immunostaining of the cerebral cortex sections, with the white line arrows defining the representative thickness of the cerebral cortex (C, n=3 mice). Quantification shows the cortex is significantly thinner in mTrappc9 m/m mice than the other two groups (D, n=6 sections). (E-F), MBP immunostaining of the striatum. The white dotted lines demarcate the striatum area (E, n=3 mice) for quantification of the coverage area of the nerve bundles in the striatum (F, n=6 sections), which shows that nerve bundles are significantly reduced in mTrappc9 m/m mice compared to WT and mTrappc9+/+ mice. (G-I), NFH immunostaining of spinal cord sections. In mTrappc9 m/m mice, there was no significant difference in gray matter (inside the white dotted line), but the area of white matter (outside the white dotted line) was reduced significantly. Representative images from n=3 mice/group (G); n=7 sections (H, I). (J-K), Western blot analysis of MBP and NFH protein expression in cerebral cortex normalized with GAPDH. Both showed a significant decrease in mTrappc9 m/m mice. n=3 mice/group. Data are means ± SEM; One-way ANOVA (B, D, F, H, I); Two-way ANOVA (K); ****P≤0.0001; ns, not significant (P>0.05). Scale bars: 50 μm (A); 150 μm (C, E, G).

Acknowledgments
This image is the copyrighted work of the attributed author or publisher, and ZFIN has permission only to display this image to its users. Additional permissions should be obtained from the applicable author or publisher of the image. Full text @ Int. J. Biol. Sci.