IMAGE

Fig. 3.

ID
ZDB-IMAGE-230707-84
Source
Figures for Zhang et al., 2023
Image
Figure Caption

Fig. 3.

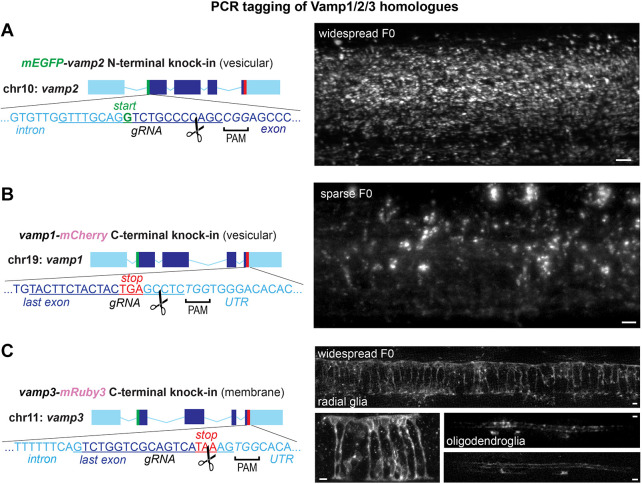
PCR tagging of related homologues Vamp1, Vamp2 and Vamp3. (A-C). Targeting additional vamp2 (N-terminal, A), vamp1 (C-terminal, B) and vamp3 (C-terminal, C) genomic loci. Representative widespread and sparse F0 larvae show vesicular mEGFP-Vamp2 and Vamp1-mCherry throughout the spinal cord and a membrane-like expression pattern of Vamp3-mRuby3 in radial and myelinating glial cells in the spinal cord. Scissors indicate predicted RNP cleavage site. Scale bars: 5 µm.

Acknowledgments
This image is the copyrighted work of the attributed author or publisher, and ZFIN has permission only to display this image to its users. Additional permissions should be obtained from the applicable author or publisher of the image. Full text @ Development