IMAGE

Fig. 2.

ID
ZDB-IMAGE-230707-83
Source
Figures for Zhang et al., 2023
Image
Figure Caption

Fig. 2.

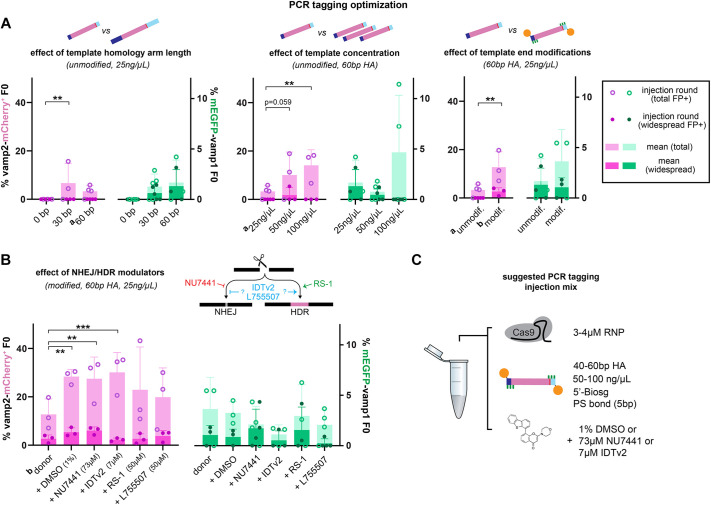
Optimization of PCR tagging injection mix. (A,B) Optimization of homology arm (HA) length, template concentration and end modification (A) and small molecule modulation of NHEJ/HDR pathways (B). Efficiency is expressed as percentage of F0 larvae that are mCherry+ or mEGFP+ at 3-5 dpf. Circles indicate individual injection rounds and bars indicate the mean of 3-5 injection rounds per condition. The number of surviving larvae analyzed per injection round varied between 9 and 253 (88 on average, for full details see Table S2). Error bars indicate standard deviation. *P<0.05, **P<0.01, ***P<0.001 (two-way ANOVA corrected for multiple comparisons). For ease of comparison, data indicated by superscript a and b are shown in more than one graph. (C) Suggested components of injection mix for PCR tagging in zebrafish. Biosg, standard biotin modification; PS, phosphorothioate bond.

Acknowledgments
This image is the copyrighted work of the attributed author or publisher, and ZFIN has permission only to display this image to its users. Additional permissions should be obtained from the applicable author or publisher of the image. Full text @ Development