
|
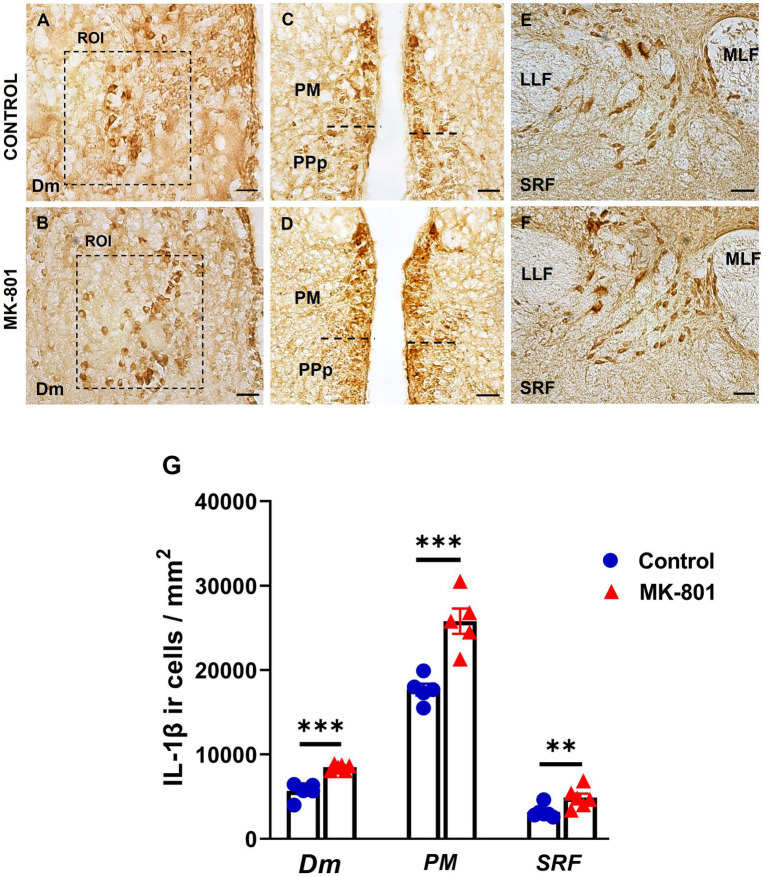
Figure 6
Excessive IL-1β expression within the SDMN and SRF, in MK-801 treated zebrafish displaying social withdrawal and anxiety-like behavior. (A–F) Representative staining for IL-1β in (A,B) medial zone of the dorsal telencephalic area (Dm), (C,D) magnocellular preoptic nucleus and (E,F) superior reticular formation (SRF) of control and MK-801 treated fish. Scale bar: 25 μm. (G) The density of IL-1β positive cells were significantly increased in MK-801 treated zebrafish, in Dm, PM and SRF, compared to control group. Bars represent the number (mean ± SEM) of IL-1β positive cells. n = 5 per experimental group. **p ≤ 0.01, ***p ≤ 0.001, compared to control group.