
Image
|
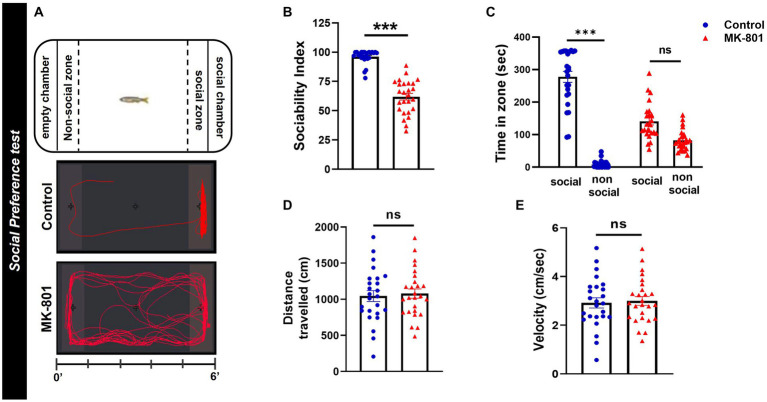
Figure Caption
Figure 2
MK-801-treated zebrafish display social impairments. (A) Diagram of social preference test and representative behavioral trajectories of control and MK-801-treated zebrafish. (B–E) Social and locomotor parameters of control and MK-801-treated fish as estimated in the social preference test. (B) Sociability index, (C) time spent in social (S) and non-social (NS) zone, (D) distance traveled, and
Acknowledgments
This image is the copyrighted work of the attributed author or publisher, and
ZFIN has permission only to display this image to its users.
Additional permissions should be obtained from the applicable author or publisher of the image.
Full text @ Front. Mol. Neurosci.