
|
Fig. 4
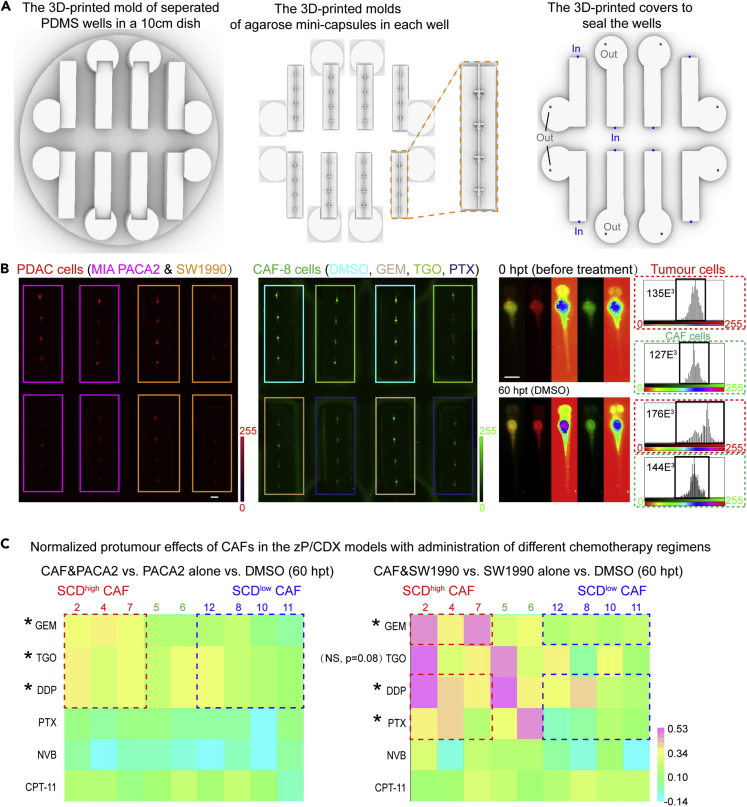
Assembly of the zPDX microarray chips to assess their responses to chemotherapy
(A) 3D-printed molds of separated PDMS wells, agarose mini-capsules, and the covers of the well. Two holes on each cover to add drugs and replace the solution every 6 h.
(B) The representative scanning images of a zPDX model chip at 0 hpt (hours post drug treatment) and 60 hpt in green and red fluorescent channels, and a representative quantitative analysis for the fluorescent signals of the tumor cells (red) and the fibroblasts (green).
(C) Summarized heatmap of the normalized viability of PDAC tumor cells in the drug-treated groups compared to the DMSO-treated control group. GEM: Gemcitabine; PTX: Paclitaxel; CPT-11: Irinotecan; NVB: Vinorelbine; DDP: Cisplatin; TGO: Tegafur. Scale bar: 300 ?m.