
Image
|
Figure Caption
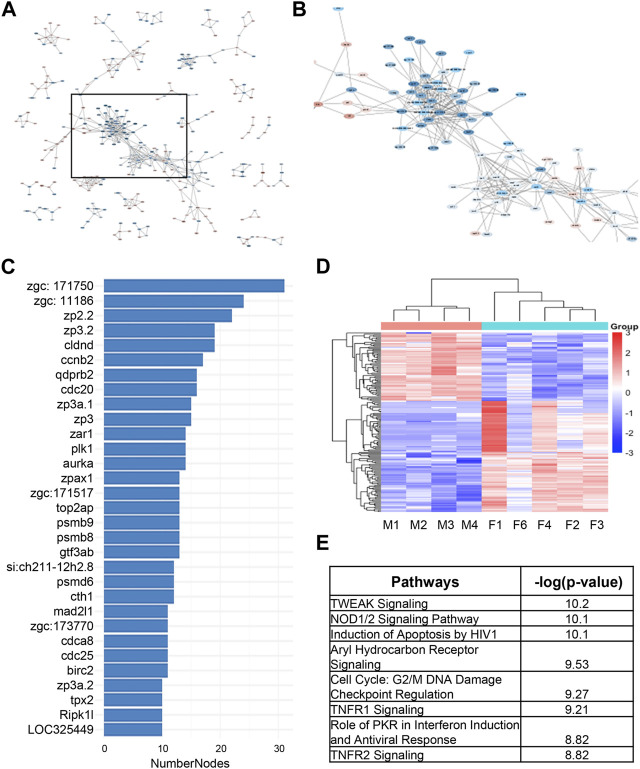
FIGURE 4
STRING analysis of differentially expressed genes underlying sex dimorphism in zebrafish kidneys. (A) String analysis of all DEGs in male vs. female zebrafish kidneys. Confidence score was set to 0.9. (B) Zoomed in area of clustered genes from (A). (C) Number of nodes in string cluster. (D) Heatmap of STRING Cluster genes in male and female zebrafish kidneys in (B). (E) IPA analysis of STRING Cluster genes in (B).
Acknowledgments
This image is the copyrighted work of the attributed author or publisher, and
ZFIN has permission only to display this image to its users.
Additional permissions should be obtained from the applicable author or publisher of the image.
Full text @ Front. Physiol.