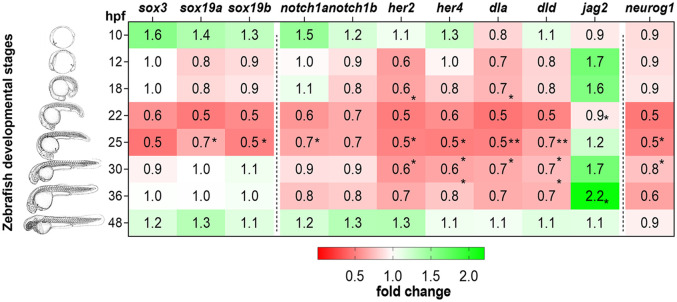
Figure 1
Expression of MTH-responsive genes reveals 22-31hpf as the developmental time more sensitive to MTH. Zebrafish developmental stages analyzed by qPCR are depicted by camera lucida drawings adapted from (46). Heatmap representation of gene expression levels of sox3, sox19a, sox19b, notch1a, notch1b, her2, her4, dla, dld, jag2a, and neurog1, determined after RT-qPCR in MCT8MO and CTRLMO during embryonic development. Data are represented as fold change of MCT8MO expression relative to the CTRLMO. Statistical differences were evaluated between MCT8MO and CTRLMO for each time point using a t-test after normal distribution was confirmed (D’Agostino & Pearson test). N = 8 (*p<0.05; **p<0.01).

