
|
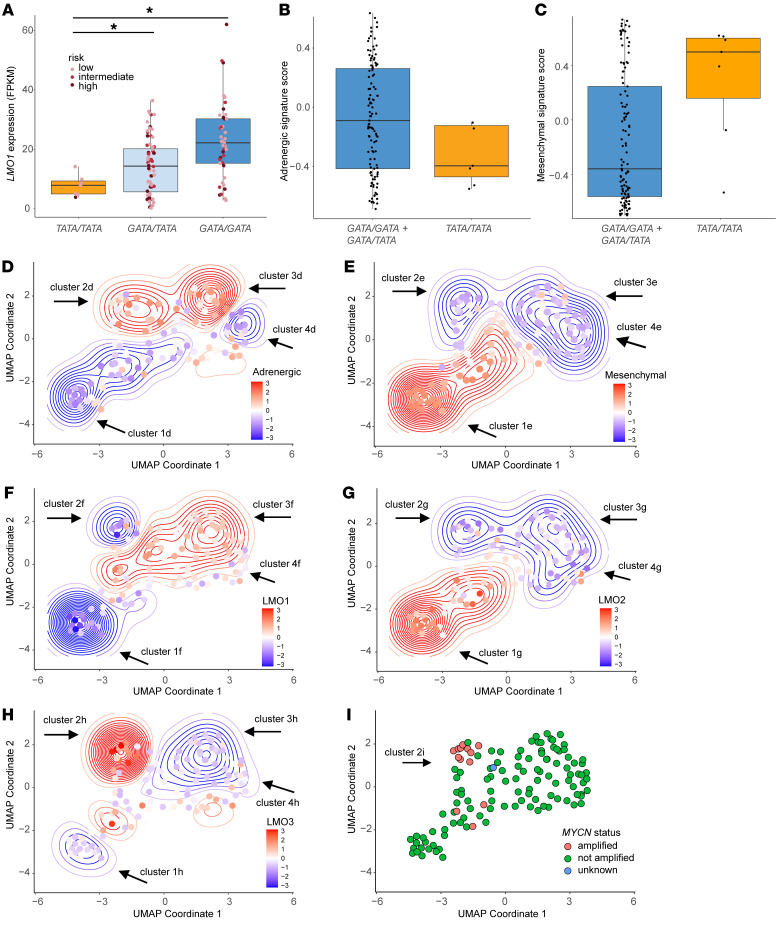
Figure 6
(A) Relative LMO1 mRNA expression levels (in FPKM) in 124 human neuroblastoma samples with the indicated genotypes at rs2168101: TATA/TATA, GATA/TATA, or GATA/GATA. Each neuroblastoma sample is assigned to either low (pink), intermediate (light red) or high risk (purple). Statistical analysis was performed using the 2-tailed, Welch?s t test. *P < 0.005. (B and C) Adrenergic and mesenchymal gene set signature scores were generated using GSVA based on the previously published expression profiles by Von Groningen, et al. (8). Higher positive scores indicate upregulation of the corresponding signature, whereas, lower negative scores indicate downregulation. GATA/GATA and GATA/TATA tumors were combined into 1 group (blue) and compared with the TATA/TATA tumors (tan). (D and E) UMAP representing the whole transcriptome landscape of 124 human neuroblastoma samples (dots) in a 2-dimensional space combined with the adrenergic (D) and mesenchymal (E) gene signatures. Relative Z-score-transformed expression for each signature (according to the heat scale) is shown for each tumor (points) and overall density (contours). Clusters 1?4 represent tumors falling into similar density contours based on the adrenergic signature (D) or mesenchymal signature (E). (F?H) Combination of UMAP dimensionality reduction analysis and expression levels of LMO1 (F), LMO2 (G), and LMO3 (H). Relative Z-score of log2-transformed expression for LMO1 (F), LMO2, (G) or LMO3 (H) (according to the heat scale) is shown for each tumor (points) and overall density (contours). (I) MYCN status for all 124 human neuroblastoma samples.