
|
Fig. 6
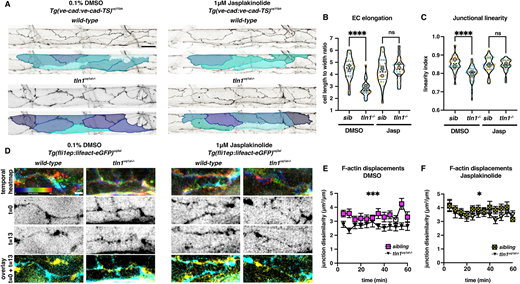
Enhancing polymerised F-actin can restore EC elongation, junctional linearity and F-actin rearrangements in tln1uq1al−/− mutants. (A) Maximum projection of the dorsal aorta at 50 hpf, directly after treatment with either 0.1% DMSO (control, left) or 1 μM jasplakinolide (Jasp, right) showing impaired EC elongation in DMSO-treated tln1uq1al−/− mutants (bottom left), which is rescued when mutants have been exposed to Jasp (bottom right). The colours present a spectrum: lighter colours indicate more elongated ECs. Scale bar: 25 µm. (B) Quantification of EC elongation at 50 hpf, showing the phenotypic rescue of EC elongation in Jasp-treated tln1uq1al−/− mutants (n=3 replicates): n=27 siblings and n=25 tln1uq1al−/− mutants in DMSO-treated group; n=27 siblings and n=22 tln1uq1al−/− mutants in Jasp-treated group. ****P<0.0001 for DMSO sibling versus tln1uq1al−/− mutant (Mann-Whitney test). For Jasp sibling versus tln1uq1al−/− mutant, no significant difference (ns) (t-test). (C) Quantification of junctional linearity at 50 hpf, showing significant rescue of linearisation in Jasp-treated tln1uq1al−/− mutants, n=3 replicates: n=27 siblings and n=33 tln1uq1al−/− mutants in DMSO-treated group; n=28 siblings and n=25 tln1uq1al−/− mutants in Jasp-treated group. ****P<0.0001 for DMSO sibling versus tln1uq1al−/− mutant (Mann-Whitney test). For Jasp sibling versus tln1uq1al−/− mutant, no significant difference (ns) (Mann–Whitney test). (D) Stills from time-lapse imaging (Movies 9 and 10) of cortical F-actin displacements in 0.1% DMSO (control, left) or 1 μM Jasp-treated (right) wild-type siblings and tln1uq1al−/− mutant embryos. Each column of images is organised as follows: top, temporal colour-coded projection of 13 timepoints imaged during the hour time-lapse; middle, greyscale images of F-actin expression at the start (t=0) and the end of the movie (t=13); bottom, overlay of t=0 (cyan) and t=13 (yellow) showing F-actin displacement. Scale bar: 5 μm. (E) Quantification of cortical F-actin displacement over the course of a 1 h time-lapse movie in 0.1% DMSO-treated siblings (yellow) and tln1uq1al−/− mutants (black). Scale bar: 10 µm. ***P<0.001 (Mann-Whitney test). (F) Quantification of cortical F-actin displacements over the course of a 1 h time-lapse movie in Jasp-treated siblings (yellow) and tln1uq1al−/− mutants (black) showing a partial rescue when compared with E, n=3 replicates: n=12 siblings and n=12 tln1uq1al−/− mutants in DMSO-treated group; n=14 siblings and n=10 tln1uq1al−/− mutants in Jasp-treated group (*P<0.05, Mann–Whitney test). In B and C, replicate averages are depicted by large circles; smaller circles indicate individual data points of each replicate (colour matched).