
|
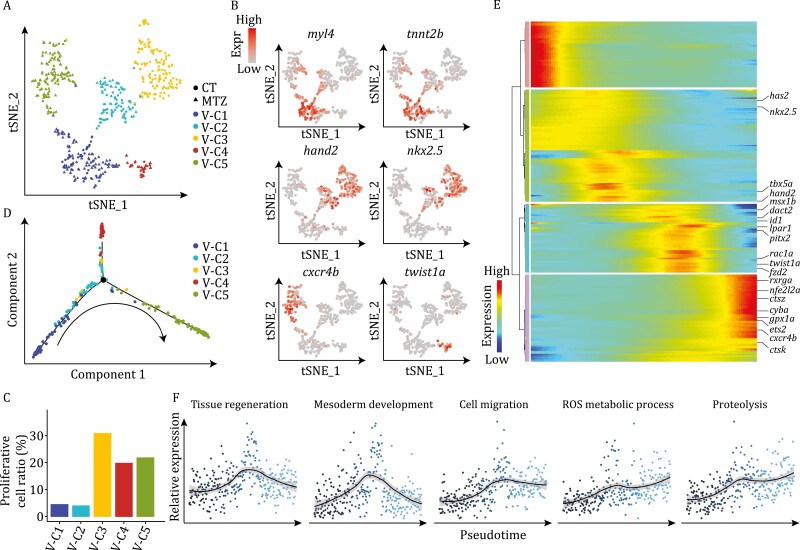
Figure 2.
Molecular signatures of ventricular cardiomyocytes during development and regeneration. (A) t-SNE analysis results of CM-V from both untreated (CT) and MTZ-treated embryos, showing classification of five populations. Each dot represents a cell, and are colored according to the clusters and shaped by sample conditions. n = 510 cells. (B) t-SNE maps showing the expression patterns of myl4, tnnt2b, hand2, nkx2.5, cxcr4b, and twist1a in CM-V. (C) Cell cycle score analysis of CM-V subpopulations. (D) Pseudotime trajectory of the MTZ-treated CM-V colored by clusters identified in (A). Arrow indicates the order of pseudotime. (E) Heatmap visualization of changes in expression of representative genes following pseudotime of MTZ-treated CM-V. (F) Pseudotemporal expression patterns of different gene ontologies. Average expression levels smoothed using LOESS are shown.