
|
Fig. 2
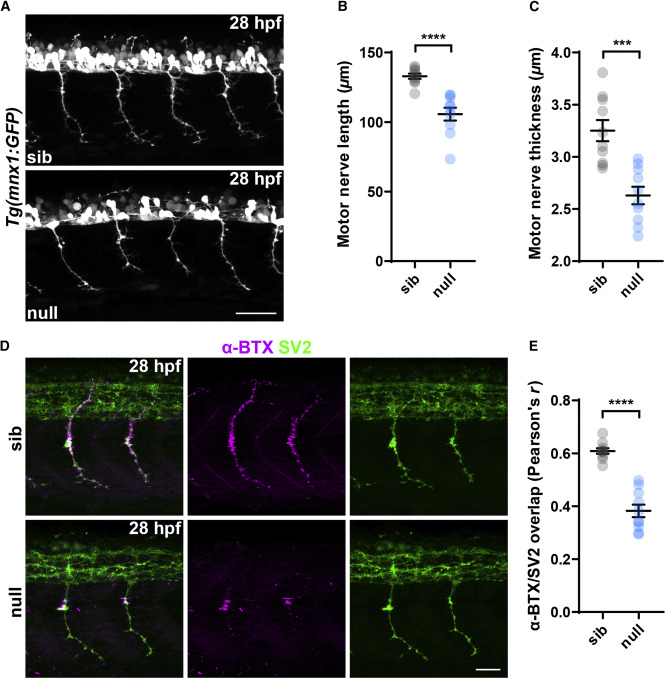
Figure 2. Loss of SNRNP70 affects motor neuron growth and neuromuscular connectivity (A) Representative maximum intensity projection images of Tg(mnx1:GFP) sibling and null trunk, lateral views with anterior to the left, at 28 hpf showing motor nerves innervating the myotome. Scale bars, 50 ?m. (B and C) Quantifications showing the length and thickness of motor nerves in the two groups. All graphs show mean values � SEM. ????p < 0.0001; ???p < 0.001, two-tailed unpaired t test, n = 10 animals per group in two independent experiments. (D) Maximum intensity projection images of sibling and null embryos at 28 hpf stained with anti-SV2 antibody to mark the pre-synaptic locations and a fluorescently tagged ?-BTX to label AChRs on post-synaptic structures. Images are lateral views with anterior to the left. Scale bars, 25 ?m. (E) Quantification of the degree of overlap between SV2 and ?-BTX. The graph shows mean values � SEM. ????p < 0.0001, two-tailed unpaired t test, n = 10 animals per group in two independent experiments See also Figure S2.