
Image
|
Figure Caption
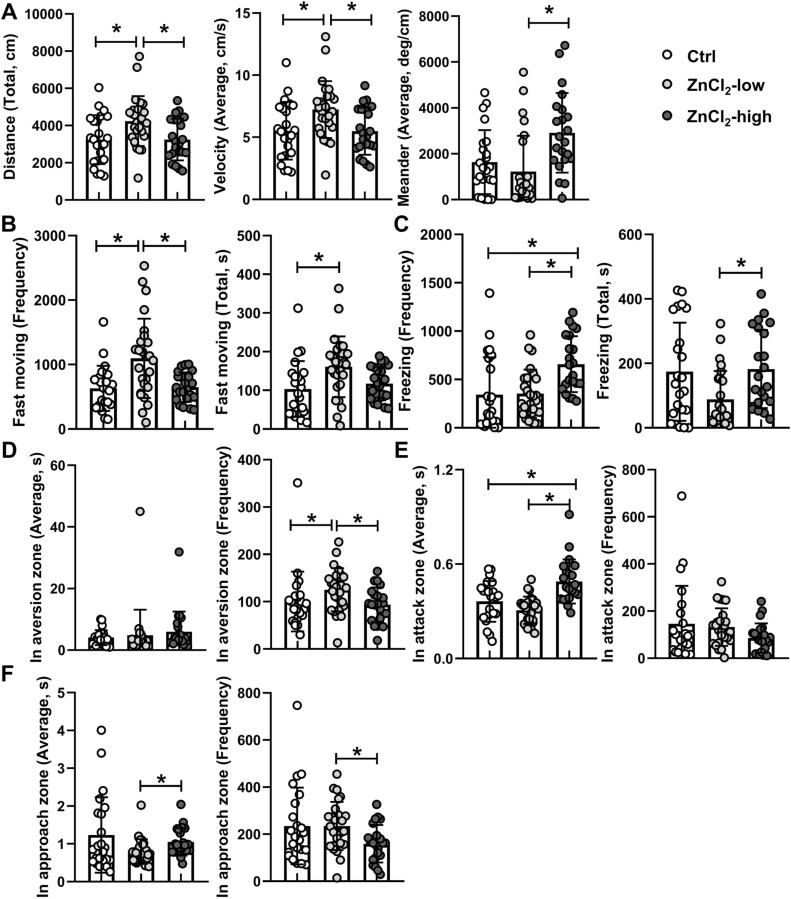
Fig. 1 Fig. 1. Comparison of behavior between control and zinc chloride-exposed groups in the Mirror biting test. The total swimming distance, average velocity and meander (A); the frequency and total duration of freezing behaviors (B); the frequency and total duration of fast moving behaviors (C); the frequency of entry and total duration in the aversion zone (D); the frequency of entry and total duration in the attack zone (E); the frequency of entry and total duration in the approach zone (F). ?*? indicates significant difference between two groups (p < 0.05, n ? 22).
Figure Data
Acknowledgments
This image is the copyrighted work of the attributed author or publisher, and
ZFIN has permission only to display this image to its users.
Additional permissions should be obtained from the applicable author or publisher of the image.
Full text @ Ecotoxicol. Environ. Saf.