
|
FIGURE 9
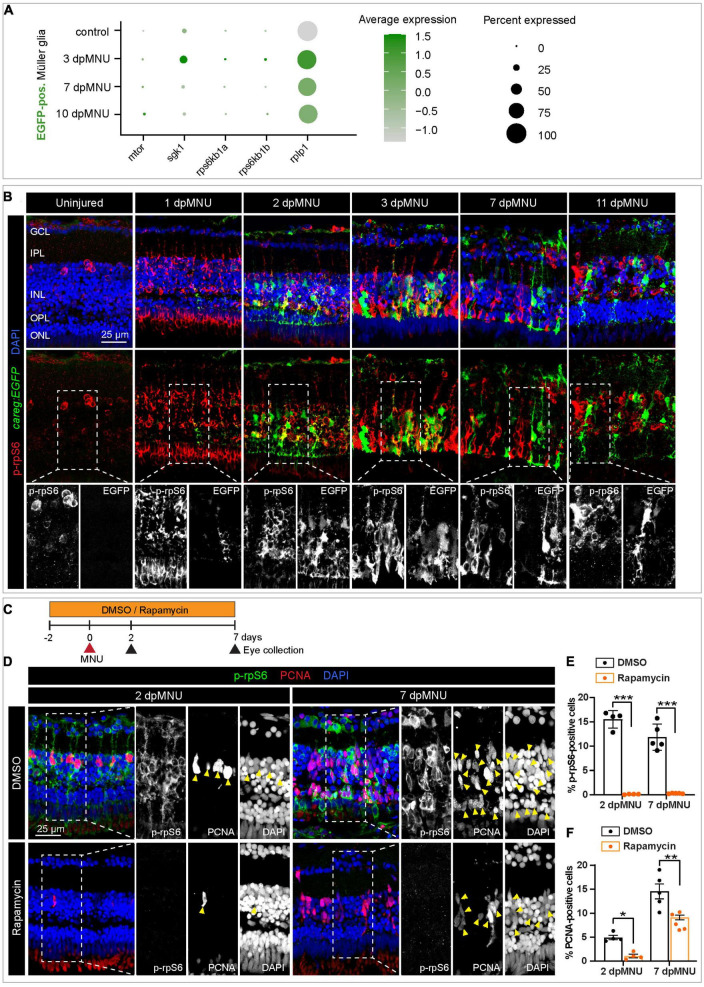
The careg element is transiently associated with phospho-rpS6-immunoreactive cells in regenerating retina. (A) Dot plot displaying differential expression levels of mtor and its downstream signaling components encoding ribosomal proteins in careg:EGFP-positive and careg:EGFP-negative M�ller glia at different conditions. (B) careg:EGFP retina sections at different time-points post-MNU-treatment immunostained against phospho-ribosomal protein S6 (p-rpS6, red) and DAPI (blue). In uninjured retina, a few p-rpS6-positive cells (red) are detected in the inner nuclear layer (INL). At 1 dpMNU, a massive increase of p-rpS6 occurs across the INL. At 2 and 3 dpMNU, a colocalization between p-rpS6 (red) and careg:EGFP (green) is observed. At 7 and 11 dpMNU, most of cells are single-positive for each of these markers. (C) Workflow with 0.1% DMSO and 1 ?M Rapamycin treatment. (D) Retina sections at 2 and 7 dpMNU treated with DMSO or Rapamycin immunostained for p-rpS6 (green), PCNA (red), and DAPI (blue). In control samples, PCNA-positive cells are also p-rpS6-positive (arrowheads). Rapamycin treatment abrogates p-rpS6 expression and reduced the number of PCNA-positive cells. (E,F) Quantification of PCNA-positive and p-rpS6-positive cells. Histogram displays average values for each group. Each dot represents a biological replicate (N > 4). Error bars, SEM. P-value was determined by two-way ANOVA with ?id�k multiple comparisons test. *P = 0.034; **P = 0.0017; ***P < 0.001.