Image
Figure Caption
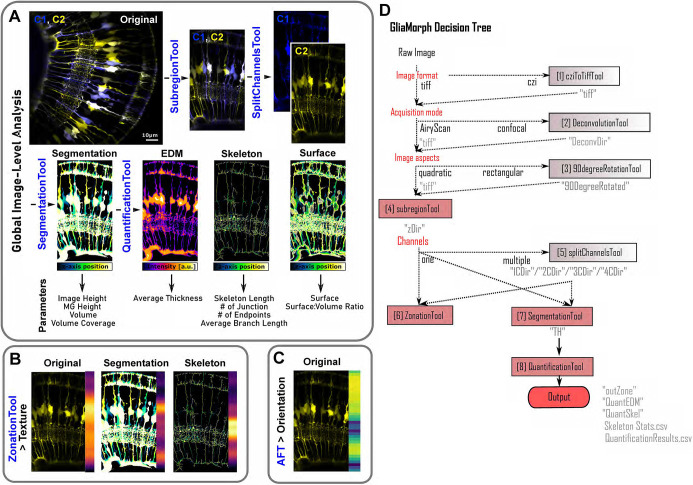
Fig. 1.
GliaMorph workflow overview. (A) Using global image-level measurements, we developed a tool to quantify 11 different parameters of MG morphology. (B) Using the zonationTool and applying it to original, segmented and skeletonized data allows insights into apicobasal subcellular feature distributions. (C) Fourier transformation-based analysis allows the assessment of apicobasal subcellular orientation distributions. (D) As GliaMorph is modular in its application, workflow design is easy and flexible to suit user needs. AFT, alignment by Fourier transform; EDM, Euclidean distance map.
Acknowledgments
This image is the copyrighted work of the attributed author or publisher, and
ZFIN has permission only to display this image to its users.
Additional permissions should be obtained from the applicable author or publisher of the image.
Full text @ Development

