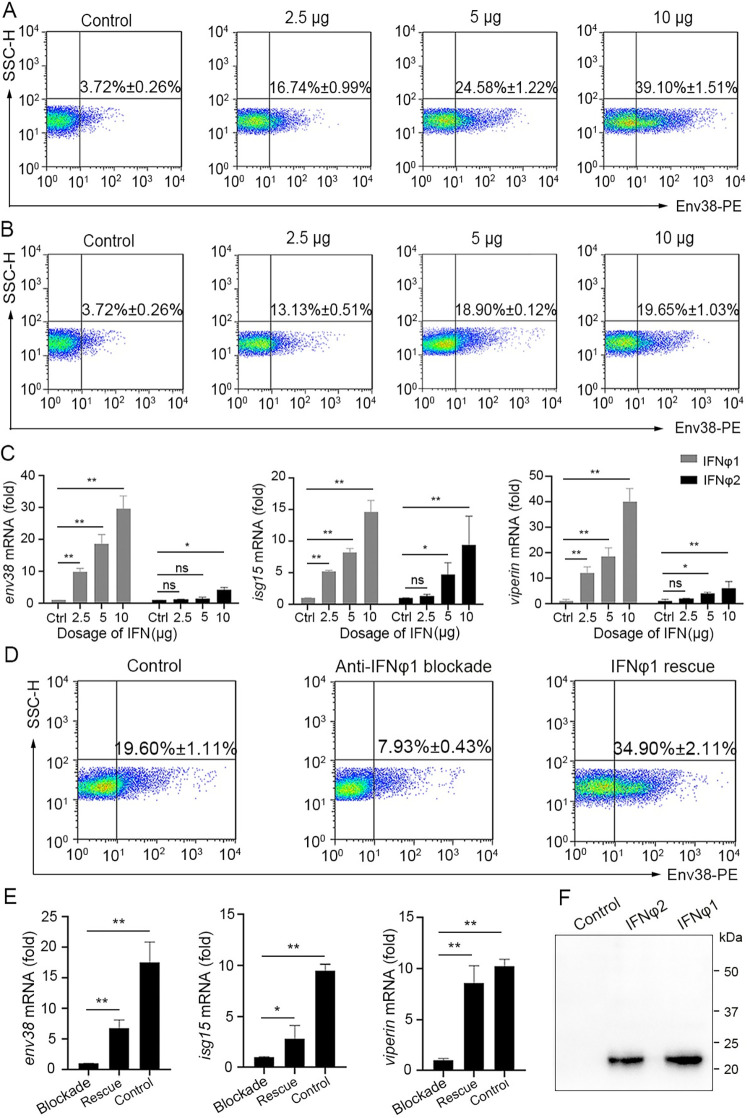
Fig 12
(A-C) Examination on the stimulatory role of zebrafish IFN?1 and IFN?2 in Env38 expression by in vivo administering recombinant IFN?1 and IFN?2 proteins. The stimulatory effect was examined by the increased percentage of Env38+ cells and the upregulated transcriptional expression of env38, isg15 and viperin genes in leukocytes from spleen, head kidney and peripheral blood of zebrafish i.p. injected with proportional dosage (2.5 ?g, 5 ?g and 10 ?g) of the IFN?1 (A) or IFN?2 (B) through FCM analysis (A and B) and RT-qPCR (C), respectively. Zebrafish i.p. injected with mock PBS was used as control. (D and E) Examination on the stimulatory role of zebrafish IFN?1 in Env38 expression by in vivo neutralization and rescue assays via administering mouse anti-IFN?1 Ab (10 ?g/fish) and recombinant IFN?1 (10 ?g/fish) back into the IFN?1-neutralized zebrafish. The stimulatory effect was examined by the percentage of Env38+ cells (D) and the expression level of env38, isg15 and viperin genes (E) in leukocytes from spleen, head kidney and peripheral blood of zebrafish in each group under stimulation with SVCV (105 TCID50). Zebrafish in the control groups were treated with isotype mouse IgG and rescued with mock PBS. (F) Western blot analysis of the recombinant IFN?1 and IFN?2 proteins with anti-Flag Ab (1:5,000) from supernatant of HEK293T cells transfected with the pcDNA3.1-His-Flag-IFN?1 and pcDNA3.1-His-Flag-IFN?2 recombinant constructs or an empty control construct. In the FCM analysis, different treatments were presented at the top of each block diagram, and the data presented in each block diagram indicated the average percentage of Env38+ cells in each treatment group. RT-qPCRs were run in combination with the endogenous ?-actin control. Error bars represented SEM. (*p < 0.05; **p < 0.01; ***p < 0.001; ns, no significant difference).

