
|
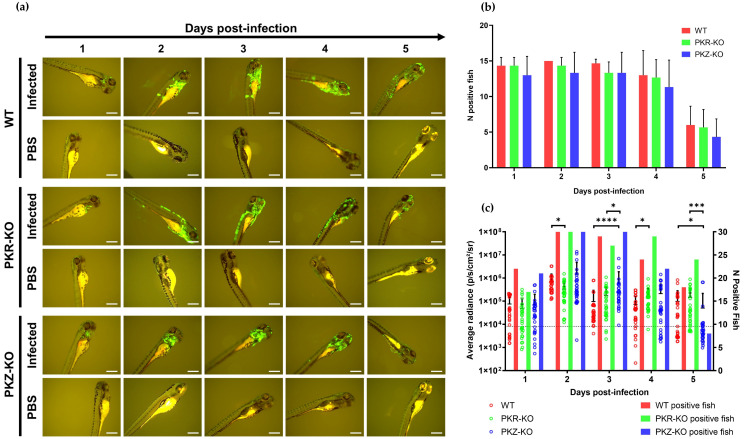
Figure 12
Replication of CyHV-3 in different zebrafish strains. (a) Epifluorescence microscopy images representative of larvae inoculated by microinjection with either CyHV-3 EGFP or mock-inoculated with PBS according to time postinfection (longitudinal observation of the same larvae over all timepoints). For all strains infection clearance commenced from 4–5 dpi. Scale bars = 500 µm. (b) Numbers of infected larvae among zebrafish strains inoculated with CyHV-3 EGFP (n = 15). Data represents mean ± standard errors from 3 independent experiments (longitudinal observation of the same larvae over all timepoints). (c) IVIS analysis measuring Luc2 expression in different zebrafish strains microinjected with CyHV-3 Luc (n = 30). The data points represent the mean radiance per larvae according to time postinfection with mean ± standard error represented for each group at each timepoint. The discontinuous line represents the cut-off for positivity and the mean + 3 × SD of the values obtained for mock-infected larvae. The number of positive larvae at each timepoint is represented by bars. * p < 0.05; *** p < 0.001; **** p < 0.0001.