
|
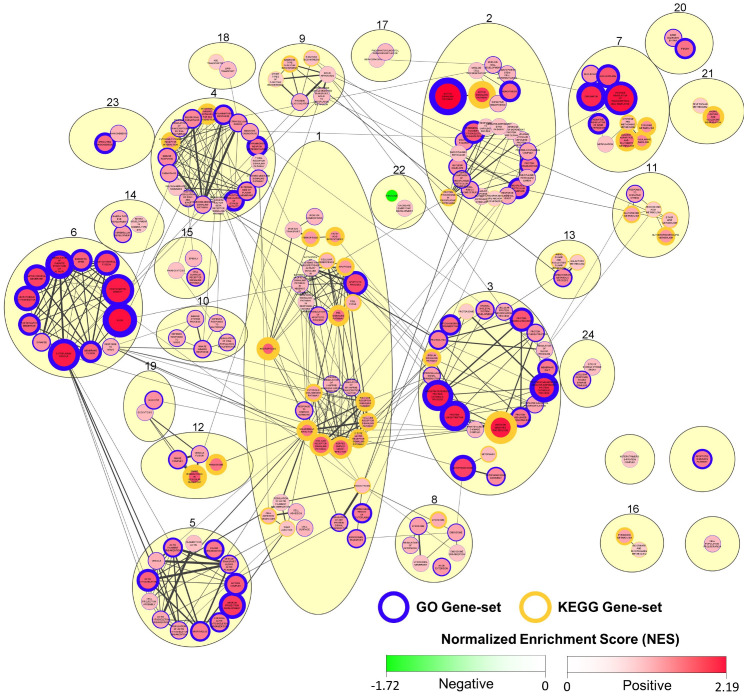
Figure 10
Summary of GSEA output indicating gene-set enrichment based on gene expression in CyHV-3-infected relative to mock-infected zebrafish larvae at 2 dpi. Cytoscape Network representing functional relationships between all significantly enriched gene-sets (positive or negative) identified in GSEA output (FDR adjusted