
|
Fig. 4
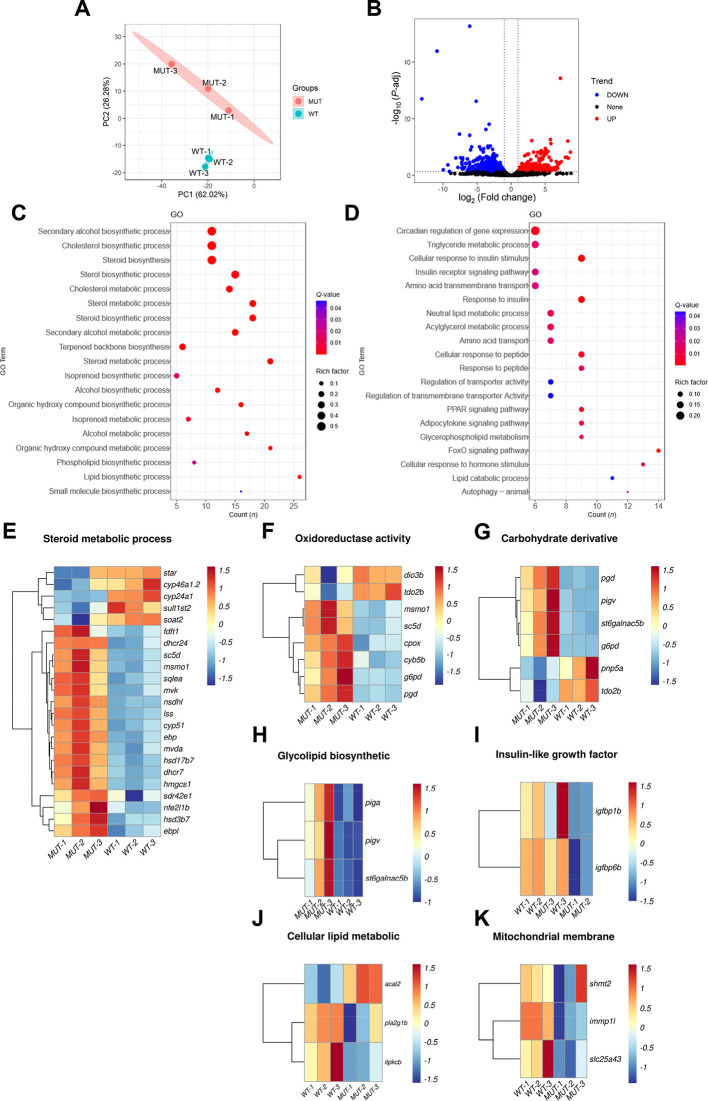
A: PCA cluster analysis of WT and mutant zebrafish liver samples. B: Volcano plot showing DEGs in two sets of samples, where blue represents down-regulated genes, red represents up-regulated genes, black represents genes with no significant difference, and each point represents a gene. C: KEGG analysis of up-regulated DEGs showing significantly enriched pathways D: KEGG analysis of down-regulated DEGs showing significantly enriched pathways. E: Heatmap of DEGs associated with steroid metabolism. F: Heatmap of DEGs associated with oxidoreductase activity. G: Heatmap of DEGs associated with carbohydrate derivative. H: Heatmap of DEGs associated with glycolipid biosynthesis. I: Heatmap of DEGs associated with insulin-like growth factor binding. J: Heatmap of DEGs related to cellular lipid metabolism. K: Heatmap of mitochondrial membrane-associated DEGs.
A: PCA cluster analysis of WT and mutant zebrafish liver samples. B: Volcano plot showing DEGs in two sets of samples, where blue represents down-regulated genes, red represents up-regulated genes, black represents genes with no significant difference, and each point represents a gene. C: KEGG analysis of up-regulated DEGs showing significantly enriched pathways D: KEGG analysis of down-regulated DEGs showing significantly enriched pathways. E: Heatmap of DEGs associated with steroid metabolism. F: Heatmap of DEGs associated with oxidoreductase activity. G: Heatmap of DEGs associated with carbohydrate derivative. H: Heatmap of DEGs associated with glycolipid biosynthesis. I: Heatmap of DEGs associated with insulin-like growth factor binding. J: Heatmap of DEGs related to cellular lipid metabolism. K: Heatmap of mitochondrial membrane-associated DEGs.