Fig. 2
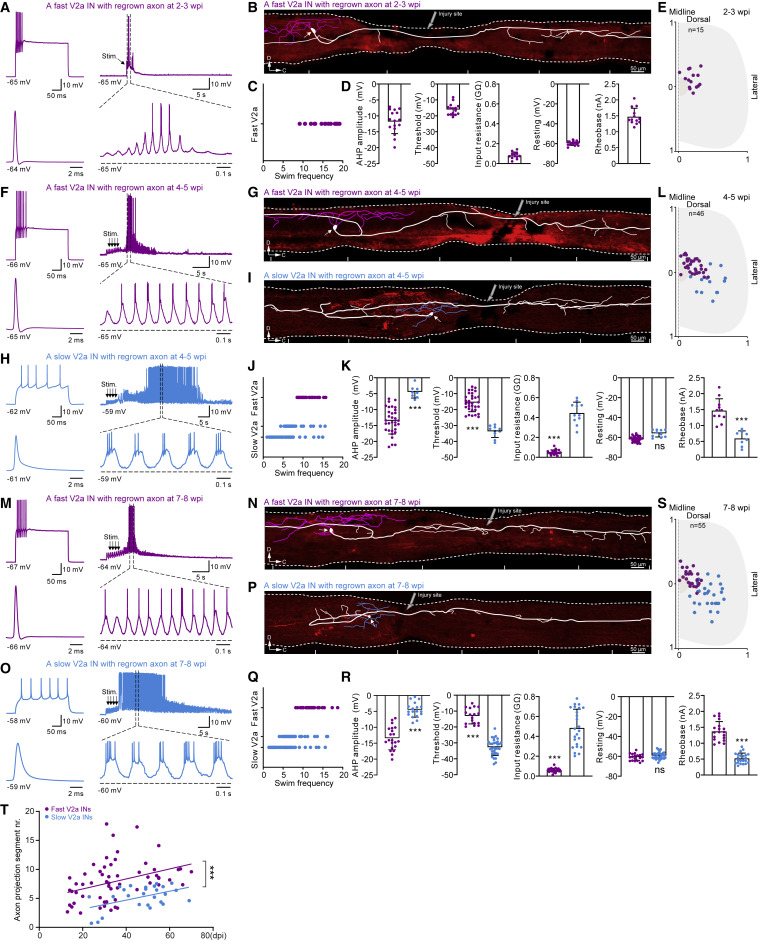
Figure 2. Orderly progression of axon regrowth of fast and slow V2a subpopulations (A, F, and M) A recorded fast V2a interneuron with regrown axons at 2?3/4?5/7?8 wpi displayed a fast-adapting firing pattern and was recruited at high locomotor frequency (>8 Hz). (B, G, and N) Reconstruction of the morphology of the fast V2a interneuron in (A, F, and M) revealed a regrown axon descending across the injury. (H and O) A recorded slow V2a interneuron with regrown axons at 4?5/7?8 wpi displayed a tonic firing pattern and was recruited at low locomotor frequency (<8 Hz). (I and P) Morphology of the slow V2a interneuron in (H and O) revealed a regrown axon descending across the injury site. (C, J, and Q) Distribution of recruited locomotor frequencies of fast (purple) and slow (blue) V2a interneurons with regrown axons at 2?3/4?5/7?8 wpi. (D, K, and R) Population data of after-hyperpolarization (AHP) amplitude, firing threshold, input resistance, resting membrane potential, and rheobase of fast (purple) and slow (blue) V2a interneuron with regrown axons at 2?3/4?5/7?8 wpi. (E, L, and S) Topographical distribution of the somata of fast (purple) and slow (blue) V2a interneurons with regrown axons recorded at 2?3/4?5/7?8 wpi along the dorsoventral and mediolateral aspects of the spinal cord. (T) Axon projection length of fast (purple) and slow (blue) V2a interneurons with regrown axons during the entire recovery period after SCI. Each dot represents one neuron, and only one neuron was recorded from each independent fish. Data are presented as mean ± SD. ???p < 0.001, significant difference. See also Figure S2
Image
Figure Caption
Acknowledgments
This image is the copyrighted work of the attributed author or publisher, and
ZFIN has permission only to display this image to its users.
Additional permissions should be obtained from the applicable author or publisher of the image.
Full text @ Cell Rep.

