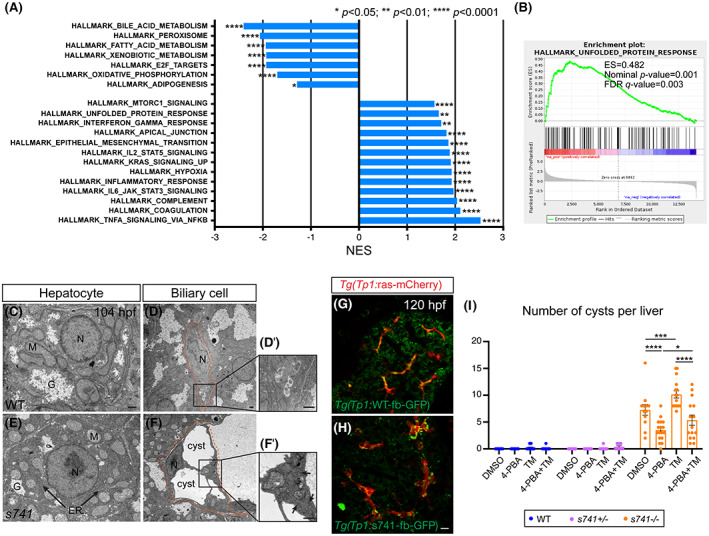
Fig. 6
The s741 mutation causes mislocalization of Furinb, which triggers endoplasmic reticulum (ER) stress. (A) Gene?set enrichment analysis (GSEA) identified gene sets that were significantly altered in s741 mutant livers with nominal p value < 0.05 and false discovery rate (FDR) < 0.01. Gene sets were ranked by normalized enrichment score (NES). (B) GSEA plot shows a significant enrichment of unfolded protein response (UPR) pathway in s741 mutant livers compared with WT livers. (C?F) TEM images of hepatocytes (C,E) and biliary cells (D,F). Biliary cells are outlined by orange dashed line in (D) and (F). (D') and (F') show the boxed areas in (D) and (F) under high magnification. Arrows in (E) and (F') point to dilated ER. Three WT and three mutants were examined. Scale bar: 1 ?m. (G,H) Confocal single?plane images showing the expression of WT and s741 mutant Furinb?GFP (fb?GFP) fusion proteins in the biliary cells marked by Tg(Tp1:ras?mCherry) expression. Sixteen WT?fb?GFP fish and 25 mut?fb?GFP fish from three rounds of injection were examined, and all had the representative protein localization. Scale bar: 10 ?m. (I) Numbers (mean ± SEM) of hepatic cysts as revealed by Tg(Tp1:GFP) expression in the larvae after treatments with 10 ?mol/L 4?4?phenylbutyric acid (4?PBA), 1 ?g/mL tunicamycin (TM), or both from 72 hpf to 120 hpf. Each dot represents an individual liver. Statistical significance was calculated by one?way ANOVA and Tukey's post?hoc test: *p < 0.05; ***p < 0.001; ****p < 0.0001. ES, enrichment score; G, glycogen; M, mitochondria; N, nucleus.

