Fig. 4
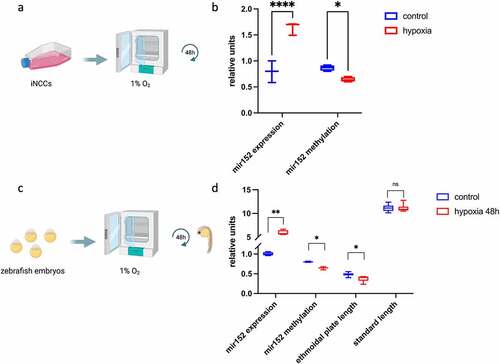
Figure 4. Hypoxia induces mir152 overexpression in human cells and zebrafish embryos and craniofacial defects in zebrafish larvae. (a) Scheme of hypoxia in induced neural crest cells (iNCCs). (b) RT-qPCR of mir152 expression in iNCCs in both control and hypoxia conditions for 48 h, showing increased expression of mir152 and reduced mir152 DNA methylation in hypoxia (p < 0.05). Units in mir152 expression values refer to relative expression normalized by RNU44; units in mir152 methylation refer to methylation indexes varying from 0 to 1. (c) Scheme of exposure to hypoxia in zebrafish embryos. (d) mir152 expression significantly increases under hypoxia for 48 h, accompanied by mir152 DNA methylation reduction and ethmoidal plate reduction. (*p < 0.05; **p < 0.005, ****p < 0.00005 Mann?Whitney?s test). Relative units at y-axis for mir152 expression refers to relative expression normalized by RNU6; units in mir152 methylation refer to methylation indexes varying from 0 to 1; units in ethmoidal plate length are in millimetres, as well as for standard length.

