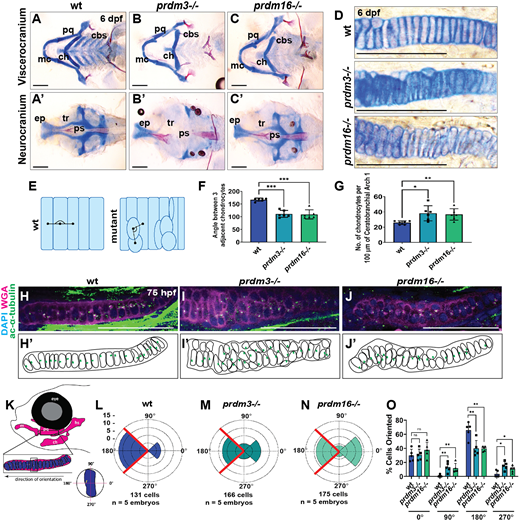
Fig. 1 prdm3 and prdm16 are necessary for chondrocyte stacking and polarity in the zebrafish craniofacial skeleton. (A-G) Wild-type (wt), prdm3?/? and prdm16?/? zebrafish embryos were collected at 6 dpf and stained with Alcian Blue and Alizarin Red. (A-D) Images of dissected and flat-mounted viscerocranium (A-C) and neurocranium (A?-C?), and high magnification of chondrocytes (D). cbs, ceratobranchials; ch, ceratohyal; ep, ethmoid plate; mc, Meckel's cartilage; pq, palatoquadrate; ps, parasphenoid; tr, trabeculae. Scale bars: 100 µm. (E,F) Quantification of chondrocyte organization (F) as schematized in E (n=6 per genotype); meanħs.d. Black lines in E indicate angle measurement between adjacent chondrocytes. (G) Quantification of the number of chondrocytes per 100 µm of tissue (n=6 per genotype); meanħs.d. (H-O) Wild-type, prdm3?/? or prdm16?/? larvae were immunostained with acetylated ?-tubulin to label MTOCs, denoting directional growth, and counterstained with DAPI and wheat germ agglutinin (WGA) at 75 hpf (H-J). Shown are lateral high-magnification views of the palatoquadrate. Scale bars: 50 µm. (H?-J?) Schematics showing misoriented chondrocytes. Green dots represent the localization of acetylated ?-tubulin puncta. (K-O) Quantification of chondrocyte polarity (positioning of acetylated ?-tubulin puncta), as depicted in K for wild type (L), prdm3?/? (M) and prdm16?/? (N). (O) Percentage of cells in each indicated quadrant normalized to the total number of cells for each genotype. (n=5 per genotype); meanħs.d. *P?0.05, **P?0.005, ***P?0.001; ns, not significant (unpaired, two-tailed Student's t-test).
Image
Figure Caption
Figure Data
Acknowledgments
This image is the copyrighted work of the attributed author or publisher, and
ZFIN has permission only to display this image to its users.
Additional permissions should be obtained from the applicable author or publisher of the image.
Full text @ Development

