
|
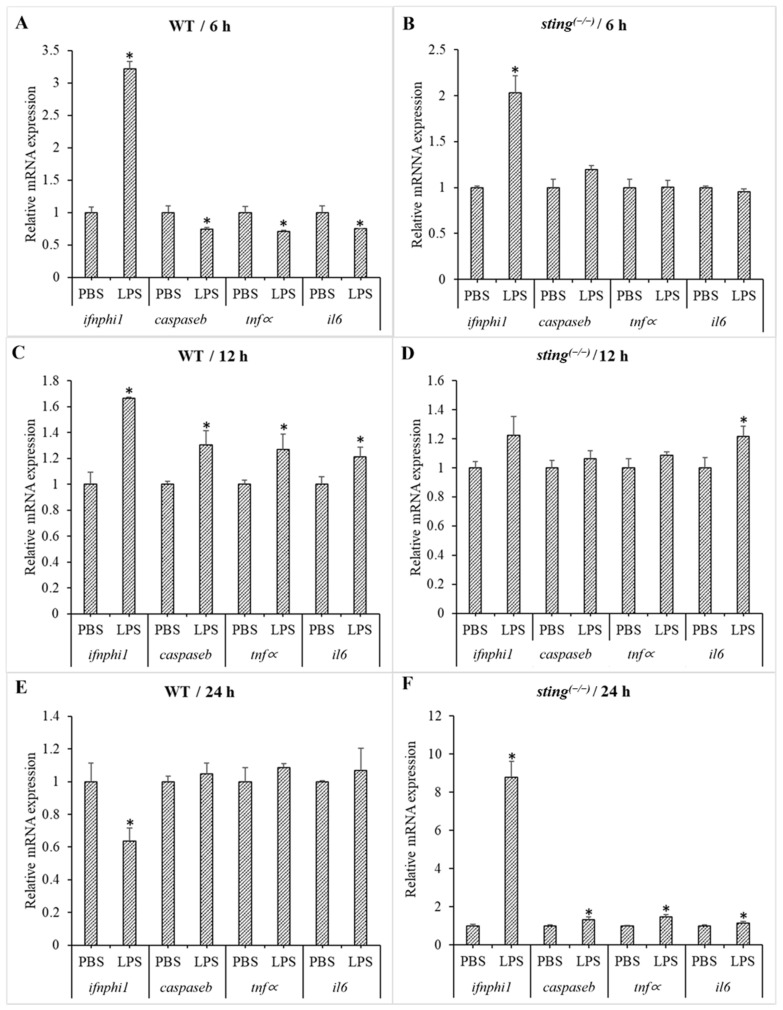
Figure 3
Comparison of gene expression in WT and sting(?/?) zebrafish larvae under LPS stimulation. The larvae samples were collected 6, 12, and 24 h post-LPS treatment of 3 dpf WT ((A,C,E) respectively) and sting(?/?) ((B,D,F) respectively) zebrafish larvae. Ef1? was used as an internal control to analyze the relative mRNA expression of genes downstream of sting using the Livak method. Transcription levels of target genes in the PBS-treated group were considered as 1, and expression levels in the LPS-treated groups were normalized to those in the PBS-treated group and are represented as fold values. Standard deviation (SD; n = 3) is indicated by the error bars. Significantly differentially transcribed genes (when compared to the respective PBS-treated control) are marked with an asterisk (*: p < 0.05).