Fig. 2
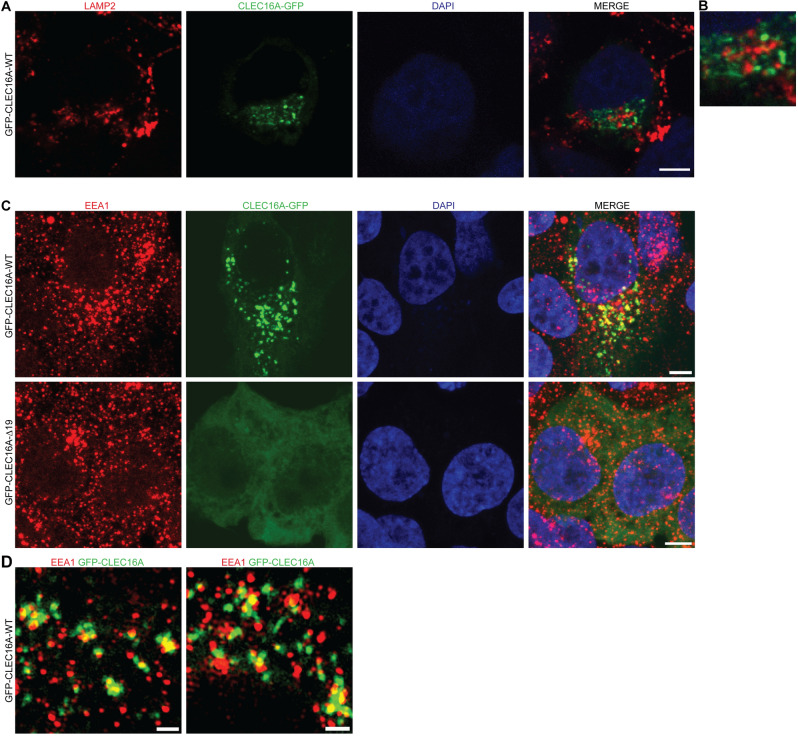
Subcellular localization of CLEC16A-WT and -?19. a Immunocytochemistry assessing co-localization of transiently expressed pEGFP-CLEC16A-WT (green) with the late endosomal/lysosomal marker LAMP2 (red). Nuclei were counterstained with DAPI. b Partial zoom of a, showing 3.5 × enlargement. c, d Immunocytochemistry assessing the localization of transiently expressed pEGFP-CLEC16A-WT (green, upper panel) and pEGFP-CLEC16A-?19 (lower panel) in HEK293T cells. Cells were stained for the early endosomal marker EEA1 (red). Nuclei were counterstained with DAPI. Overview images were made with confocal microscopy (c) and high-resolution images were with 3D-SIM super-resolution microscopy (d). Two representative images of pEGFP-CLEC16A-WT made with 3D-SIM super-resolution microscopy are shown in d. Scale bars represent 5 µm (a, c) and 1 µm (d)

