Figure 2
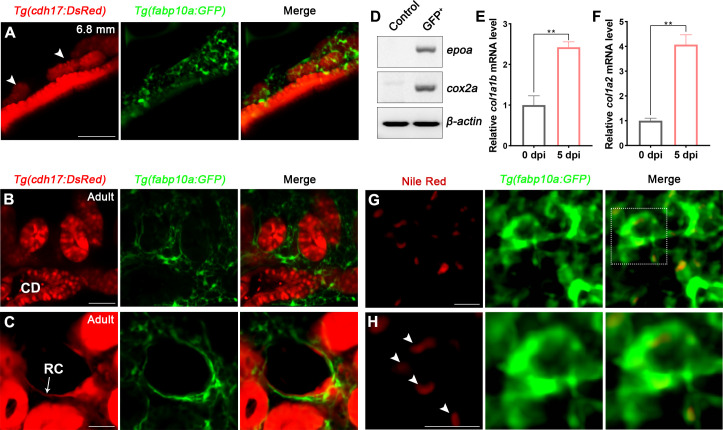
(A) Localization of Tg(fabp10a:GFP) labeled-RICs in 6.8 mm stage juvenile zebrafish. Tg(cdh17:DsRed) labeled renal tubules (arrowheads, new mesonephric branches; n = 6). (B, C) In adult zebrafish kidney, Tg(fabp10a:GFP) marks RICs (n = 3), while Tg(cdh17:DsRed) labels CD and also renal capsule (RC). Tg(fabp10a:GFP) cells form a network to tightly wrap kidney tubules (B) and capsules (C). CD, collecting duct; RC, renal capsule. (D) RT-PCR analysis of the expression of epoa and cox2a. β-actin was used as a sample control. GFP+ indicates cells with only GFP fluorescence; control indicates all cells except GFP+/DsRed- cells. (E, F) col1a1b and col1a2 mRNA levels in Tg(fabp10a:GFP)-labeled GFP+/DsRed- cells were quantified by qPCR. Both were significantly increased at 5 dpi (n = 3). Both genes were normalized to the mean expression level at 0 dpi, which was set to 1. **p<0.01 by one-way ANOVA. (G) Nile red staining section of Tg(fabp10a:GFP) zebrafish kidney showing that Tg(fabp10a:GFP)-labeled cells contained plentiful lipid droplets. (H) Higher-magnification image of the boxed area showed in (G) (arrowheads, lipid droplets). n = 3. Scale bar in (A–C), 100 μm; (G, H), 20 μm.
Renal interstitial cells (RICs) are specifically labeled by fabp10a:GFP in transgenic zebrafish.
Image
Figure Caption
Acknowledgments
This image is the copyrighted work of the attributed author or publisher, and
ZFIN has permission only to display this image to its users.
Additional permissions should be obtained from the applicable author or publisher of the image.
Full text @ Elife

