
|
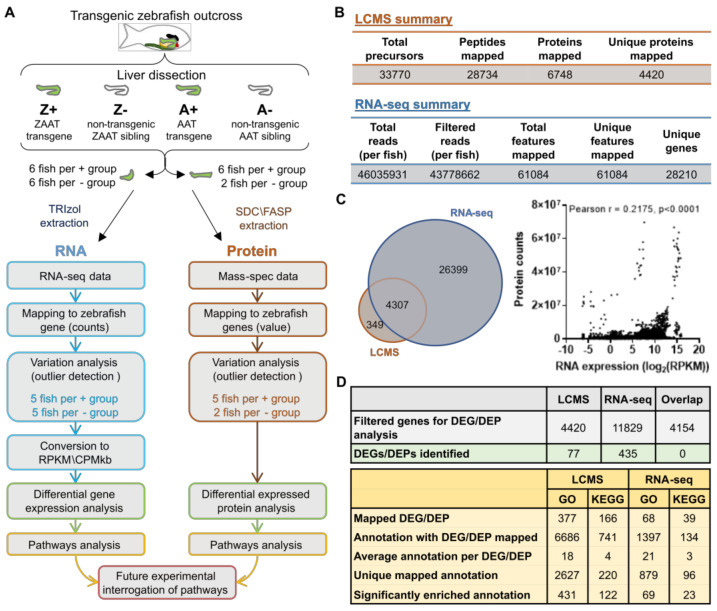
Figure 1
Overview of the global transcriptomic/proteomic approach to identify dysregulated pathways in ZAAT-expressing zebrafish livers. (A) Six fish in each genotype group were analysed, with protein and RNA samples extracted from each liver sample. Fish identified as outliers were excluded from subsequent analysis (see Supplementary Figure S2). (B) Summary statistics of LC-MS/MS and RNA-seq data aligned to the reference library or genome. (C) Comparison of libraries generated from RNA-seq and LC-MS/MS data (left panel). Correlation analysis of transcriptomic and proteomic expression profiles (right panel). Each point represents protein (counts) and RNA (log2CPM/kb) expression data from one gene in one fish. (Pearson r, r = 0.2157, p < 0.0001). (D) Summary statistics of differential expression analysis (top panel) and pathway enrichment analysis (bottom panel).