
|
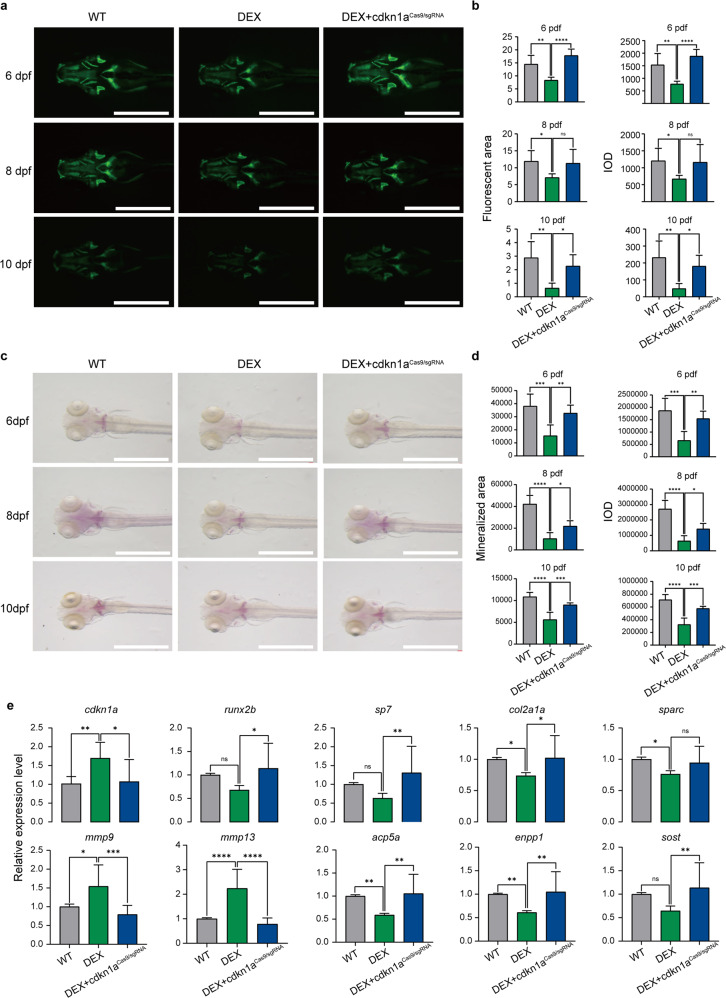
Fig. 8
a GFP images of WT, DEX-treated and DEX-treated cdkn1aCas9/sgRNA zebrafish head regions at 6, 8, and 10 dpf. Scale bars: 1 mm. b Semiquantitative analysis of GFP area and IOD (n = 6). c Alizarin red staining was used to evaluate the bone mineralization in the WT, DEX-treated, and DEX-treated cdkn1aCas9/sgRNA groups at 6, 8, and 10 dpf. Scale bar: 1 mm. d Semiquantitative analysis of Alizarin red staining activity (n = 6). e The mRNA expression levels of genes related to osteoblasts (runx2b, sp7, col2a1a, sparc) and osteoclasts (mmp9, mmp13, acp5a, enpp1, sost) in the WT, DEX-treated, and DEX-treated cdkn1aCas9/sgRNA groups (n = 20). *P < 0.05, **P < 0.01, ***P < 0.001, ****P < 0.0001, one-way ANOVA.